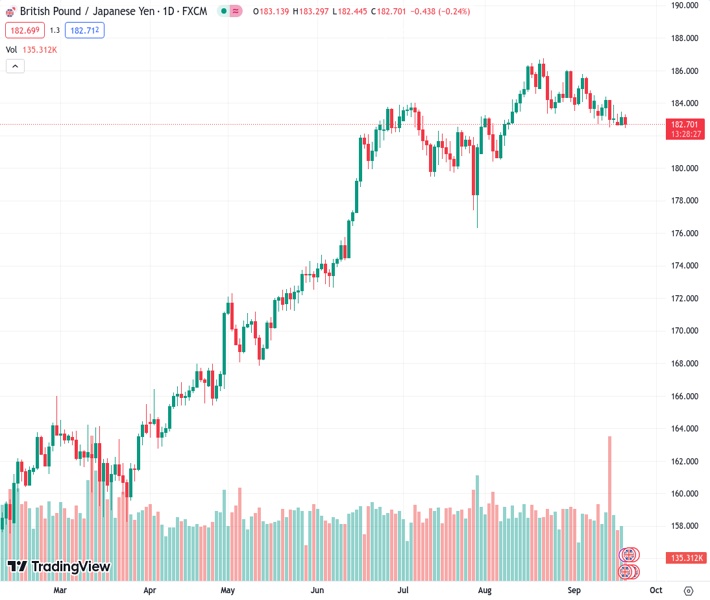
The GBPJPY currency pair is still experiencing selling pressure around 182.65 following the release of disappointing economic data from the UK.
…
This is a premium post.
[s2If !current_user_can(access_s2member_level4)]Please register for FREE REGISTER to read full post below containing analysis. In case of any error or you think you are not able to read the full post below, please email us at support#nehcap.com [lwa][/s2If] [s2If current_user_can(access_s2member_level1)]
- GBP/JPY remains under selling pressure near 182.65 after the UK’s weaker-than-expected data.
The pair currently trades last at 182.703.
The previous day high was 183.49 while the previous day low was 182.72. The daily 38.2% Fib levels comes at 183.2, expected to provide resistance. Similarly, the daily 61.8% fib level is at 183.02, expected to provide resistance.
The GBP/JPY cross loses momentum during the early European session on Wednesday. The British Pound (GBP) faces some selling pressure following the softer-than-expected economic data from the UK. The market mood remains cautious as investors await the Bank of England (BoE) interest rate decision on Thursday. The cross currently trades near 182.65, losing 0.31% on the day.
The latest data from the UK’s Office for National Statistics reported on Wednesday revealed that the nation’s Consumer Price Index (CPI) dropped to 6.7% YoY in August from 6.8% in the previous reading, below the market consensus of 7.1%. In the same period, the Core CPI, which excludes volatile food and energy prices, fell to 6.2% from 6.9% in the previous month. Additionally, the Retail Price Index climbed 9.1% YoY in August, compared to expectations of 9.3%. In response to the data, GBP/JPY dropped more than 50 pips to below the 183.00 mark.
From the technical perspective, the GBP/JPY cross trades within the descending trend-channel since the middle of August. The cross holds below the 50- and 100-hour Exponential Moving Averages (EMAs) with a downward slope on the four-hour chart, highlighting the path of least resistance for the cross is to the downside.
The first resistance level of GBP/JPY is seen at a psycholocal mark of 183.00, followed by 183.42 (the 50-hour EMA). The additional upside filter to watch is 183.75 (the 100-hour EMA). Further north, the next stop is located near the upper boundary of the descending trend-channel at 184.55. Any meaningful follow-through buying will see the next stop at 185.25 (a high of August 29)/
On the downside, a decisive break below the lower limit of the descending trend-channel at 182.20 will see a drop to a psychological round figure at 182.00 en route to 181.38 (a low of August 8) and finally at 180.90 (a low of July 30).
Furthermore, the Relative Strength Index (RSI) is located in bearish territory below 50, highlighting that further downside cannot be ruled out.
Technical Levels: Supports and Resistances
GBPJPY currently trading at 182.88 at the time of writing. Pair opened at 183.23 and is trading with a change of -0.19 % .
| Overview | Overview.1 | |
|---|---|---|
| 0 | Today last price | 182.88 |
| 1 | Today Daily Change | -0.35 |
| 2 | Today Daily Change % | -0.19 |
| 3 | Today daily open | 183.23 |
The pair is trading below its 20 Daily moving average @ 184.12, below its 50 Daily moving average @ 183.2 , above its 100 Daily moving average @ 179.69 and above its 200 Daily moving average @ 171.01
| Trends | Trends.1 | |
|---|---|---|
| 0 | Daily SMA20 | 184.12 |
| 1 | Daily SMA50 | 183.20 |
| 2 | Daily SMA100 | 179.69 |
| 3 | Daily SMA200 | 171.01 |
The previous day high was 183.49 while the previous day low was 182.72. The daily 38.2% Fib levels comes at 183.2, expected to provide resistance. Similarly, the daily 61.8% fib level is at 183.02, expected to provide resistance.
Note the levels of interest below:
- Pivot support is noted at 182.8, 182.38, 182.04
- Pivot resistance is noted at 183.58, 183.92, 184.34
| Levels | Levels.1 |
|---|---|
| Previous Daily High | 183.49 |
| Previous Daily Low | 182.72 |
| Previous Weekly High | 184.39 |
| Previous Weekly Low | 182.52 |
| Previous Monthly High | 186.77 |
| Previous Monthly Low | 180.46 |
| Daily Fibonacci 38.2% | 183.20 |
| Daily Fibonacci 61.8% | 183.02 |
| Daily Pivot Point S1 | 182.80 |
| Daily Pivot Point S2 | 182.38 |
| Daily Pivot Point S3 | 182.04 |
| Daily Pivot Point R1 | 183.58 |
| Daily Pivot Point R2 | 183.92 |
| Daily Pivot Point R3 | 184.34 |
[/s2If]
Download Nehcap EAWe have two EAs that are operational on our LIVE accounts.
- EA-FIX: Check out the details here. Download EA-FIX . EA-FIX is a non-grid HFT scalper.
- EA-GROWTH: High quality low dd EA using trend grids. Download EA_GROWTHJoin Our Telegram Group


