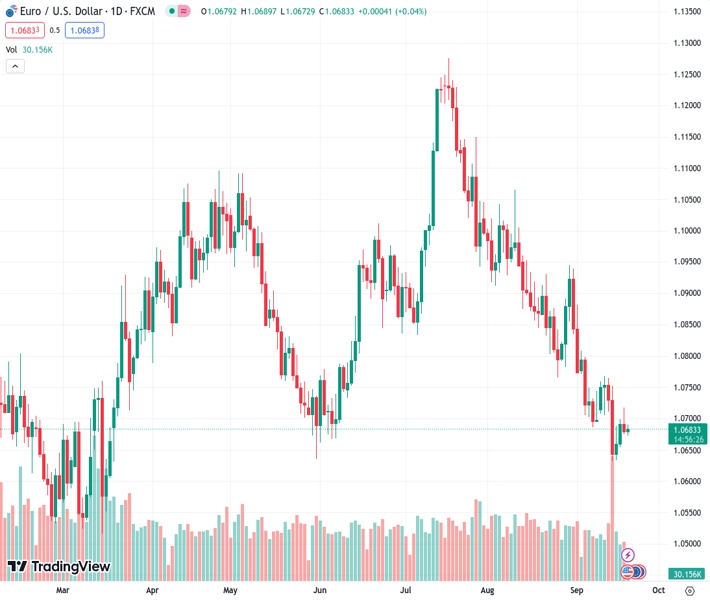
The EURUSD pair, currently trading at 1.06774, is having difficulty recovering from its recent losses due to market apprehension prior to the Federal Reserve’s decision.
…
This is a premium post.
[s2If !current_user_can(access_s2member_level4)]Please register for FREE REGISTER to read full post below containing analysis. In case of any error or you think you are not able to read the full post below, please email us at support#nehcap.com [lwa][/s2If] [s2If current_user_can(access_s2member_level1)]
- EUR/USD struggles to retrace the recent losses amid market caution ahead of Fed decision.
The pair currently trades last at 1.06774.
The previous day high was 1.0718 while the previous day low was 1.0675. The daily 38.2% Fib levels comes at 1.0691, expected to provide resistance. Similarly, the daily 61.8% fib level is at 1.0702, expected to provide resistance.
EUR/USD attempts to recover from the previous day’s losses, hovering around 1.0680 during the Asian session on Wednesday. The pair remains sideways due to the market caution ahead of the interest rate decision by the US Federal Reserve (Fed), scheduled for release later in the North American session.
The key support for the EUR/USD pair appears around the 1.0650 psychological level, followed by the previous week’s low at 1.0631.
If bearish sentiment continues to exert pressure, there is a possibility that the currency pair could approach the next support level around the significant psychological level of 1.0600.
On the upside, the EUR/USD pair could face a barrier around the 1.0700 psychological level, followed by the 12-day Exponential Moving Average (EMA) at 1.0713.
A firm break above the latter could open the doors for the pair to explore the region around the 21-day EMA at 1.0754 aligned to the 23.6% Fibonacci retracement at 1.0783 level.
The Moving Average Convergence Divergence (MACD) line remains below the centerline but lies above the signal line. This configuration indicates that the shorter-term moving average is trending higher than the longer-term moving average, which is a positive signal for potential price appreciation.
However, the selling pressure in the EUR/USD pair prevails as the 14-day Relative Strength Index (RSI) lies below the 50 level.
Technical Levels: Supports and Resistances
EURUSD currently trading at 1.0682 at the time of writing. Pair opened at 1.068 and is trading with a change of 0.02 % .
| Overview | Overview.1 | |
|---|---|---|
| 0 | Today last price | 1.0682 |
| 1 | Today Daily Change | 0.0002 |
| 2 | Today Daily Change % | 0.0200 |
| 3 | Today daily open | 1.0680 |
The pair remains strongly bearish on the daily time frame. It trades below the 20 SMA @ 1.0763, 50 SMA 1.0918, 100 SMA @ 1.0889 and 200 SMA @ 1.0829.
| Trends | Trends.1 | |
|---|---|---|
| 0 | Daily SMA20 | 1.0763 |
| 1 | Daily SMA50 | 1.0918 |
| 2 | Daily SMA100 | 1.0889 |
| 3 | Daily SMA200 | 1.0829 |
The previous day high was 1.0718 while the previous day low was 1.0675. The daily 38.2% Fib levels comes at 1.0691, expected to provide resistance. Similarly, the daily 61.8% fib level is at 1.0702, expected to provide resistance.
Note the levels of interest below:
- Pivot support is noted at 1.0664, 1.0648, 1.0621
- Pivot resistance is noted at 1.0707, 1.0734, 1.075
| Levels | Levels.1 |
|---|---|
| Previous Daily High | 1.0718 |
| Previous Daily Low | 1.0675 |
| Previous Weekly High | 1.0769 |
| Previous Weekly Low | 1.0632 |
| Previous Monthly High | 1.1065 |
| Previous Monthly Low | 1.0766 |
| Daily Fibonacci 38.2% | 1.0691 |
| Daily Fibonacci 61.8% | 1.0702 |
| Daily Pivot Point S1 | 1.0664 |
| Daily Pivot Point S2 | 1.0648 |
| Daily Pivot Point S3 | 1.0621 |
| Daily Pivot Point R1 | 1.0707 |
| Daily Pivot Point R2 | 1.0734 |
| Daily Pivot Point R3 | 1.0750 |
[/s2If]
Download Nehcap EAWe have two EAs that are operational on our LIVE accounts.
- EA-FIX: Check out the details here. Download EA-FIX . EA-FIX is a non-grid HFT scalper.
- EA-GROWTH: High quality low dd EA using trend grids. Download EA_GROWTHJoin Our Telegram Group


