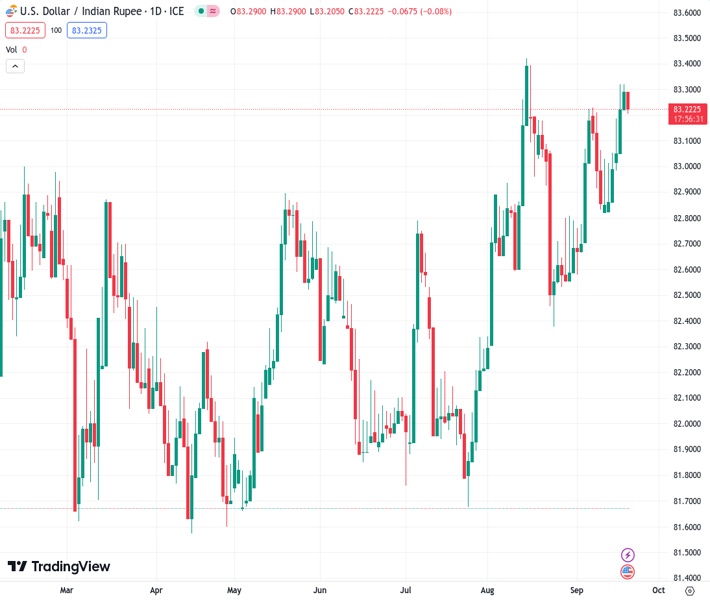
The exchange rate of the US dollar against the Indian rupee, currently at 83.1990, is declining in anticipation of the Federal Reserve’s upcoming monetary policy announcement.
…
This is a premium post.
[s2If !current_user_can(access_s2member_level4)]Please register for FREE REGISTER to read full post below containing analysis. In case of any error or you think you are not able to read the full post below, please email us at support#nehcap.com [lwa][/s2If] [s2If current_user_can(access_s2member_level1)]
- USD/INR trades lower ahead of Fed policy decision.
The pair currently trades last at 83.1990.
The previous day high was 83.5128 while the previous day low was 83.1424. The daily 38.2% Fib levels comes at 83.3714, expected to provide resistance. Similarly, the daily 61.8% fib level is at 83.2839, expected to provide resistance.
USD/INR attempts to snap the winning streak that began on September 12, trading lower around 83.20 during the Asian session on Wednesday.
However, the pair experienced upward support driven by the higher US Treasury yields. The pair could break the intraday high at 83.29, followed by the 83.50 psychological level. However, market participants expect the Reserve Bank of India (RBI) to intervene by selling US Dollar (USD), attempting to slow down the USD rally.
Additionally, elevated Crude oil prices exert downward pressure on the Indian Rupee (INR) because India relies heavily on oil imports to meet its energy needs. Moreover, the surge in oil prices is widening India’s trade deficit gap.
US Dollar Index (DXY) witnessed a fluctuating pattern during the American trading session on Tuesday. Initially, it dipped to 104.80 in response to worsening market sentiment. However, it swiftly rebounded due to the uptick in US Treasury yields, surpassing the 105.00 level once again.
DXY trades higher near 105.20 at the time of writing, reinforced by higher US Treasury bond yields. The US 10-year Treasury yield stands at 4.36% by the press time, below its highest level in 16 years.
Investors expect that the US Federal Reserve (Fed) will maintain interest rates within the existing 5.25%-5.50% range in September. Moreover, as per the CME FedWatch Tool, the odds of another rate hike during the November and December meetings have been reduced.
However, the market sentiment appears to be that the Fed will keep higher policy rates for a prolonged period could bolster the Greenback. This is attributed to the resilience of the US economy, marked by the easing of inflationary pressures and consistent labor market growth.
According to a Reuters report, US Treasury Secretary Janet Yellen mentioned on Tuesday that, as the economy is operating at full employment, it’s essential for US growth to slow down to a pace that aligns with its potential growth rate in order to bring inflation back to target levels.
Yellen also said “I think the Chinese would most likely use the policy space they have to try to avoid a slowdown with major proportions. There may be spillovers from China’s economic difficulties to the US.”
Traders will likely watch the “dot plots” to assess the anticipated interest rate trajectory. According to the most recent Summary of Economic Projections (SEP), the median estimate from the Fed suggests that interest rates could potentially reach a peak of 5.6%.
Technical Levels: Supports and Resistances
USDINR currently trading at 83.2434 at the time of writing. Pair opened at 83.2984 and is trading with a change of -0.07 % .
| Overview | Overview.1 | |
|---|---|---|
| 0 | Today last price | 83.2434 |
| 1 | Today Daily Change | -0.0550 |
| 2 | Today Daily Change % | -0.0700 |
| 3 | Today daily open | 83.2984 |
The pair remains strongly bullish on the daily timeframe. It trades above its 20 SMA @ 82.912, 50 SMA 82.6993, 100 SMA @ 82.4929 and 200 SMA @ 82.3551.
| Trends | Trends.1 | |
|---|---|---|
| 0 | Daily SMA20 | 82.9120 |
| 1 | Daily SMA50 | 82.6993 |
| 2 | Daily SMA100 | 82.4929 |
| 3 | Daily SMA200 | 82.3551 |
The previous day high was 83.5128 while the previous day low was 83.1424. The daily 38.2% Fib levels comes at 83.3714, expected to provide resistance. Similarly, the daily 61.8% fib level is at 83.2839, expected to provide resistance.
Note the levels of interest below:
- Pivot support is noted at 83.123, 82.9475, 82.7526
- Pivot resistance is noted at 83.4934, 83.6883, 83.8638
| Levels | Levels.1 |
|---|---|
| Previous Daily High | 83.5128 |
| Previous Daily Low | 83.1424 |
| Previous Weekly High | 83.2896 |
| Previous Weekly Low | 82.5035 |
| Previous Monthly High | 83.5505 |
| Previous Monthly Low | 82.2240 |
| Daily Fibonacci 38.2% | 83.3714 |
| Daily Fibonacci 61.8% | 83.2839 |
| Daily Pivot Point S1 | 83.1230 |
| Daily Pivot Point S2 | 82.9475 |
| Daily Pivot Point S3 | 82.7526 |
| Daily Pivot Point R1 | 83.4934 |
| Daily Pivot Point R2 | 83.6883 |
| Daily Pivot Point R3 | 83.8638 |
[/s2If]
Download Nehcap EAWe have two EAs that are operational on our LIVE accounts.
- EA-FIX: Check out the details here. Download EA-FIX . EA-FIX is a non-grid HFT scalper.
- EA-GROWTH: High quality low dd EA using trend grids. Download EA_GROWTHJoin Our Telegram Group


