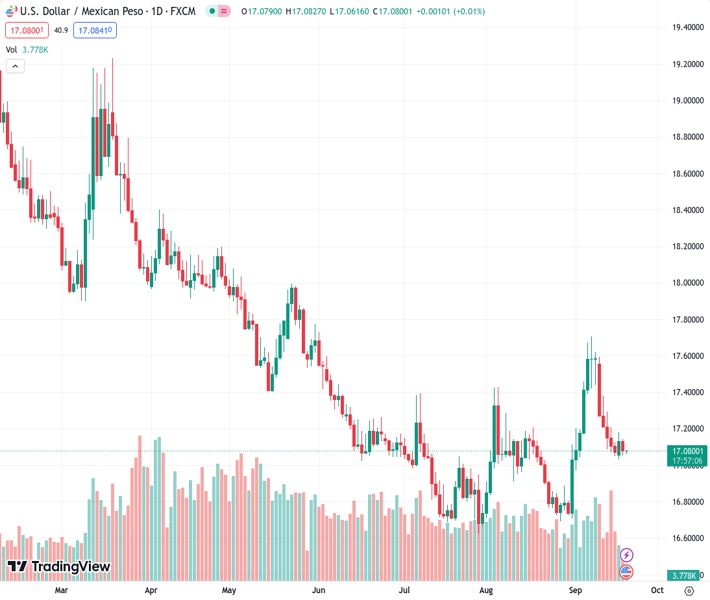
The US dollar to Mexican peso exchange rate, with a value of 17.0788, fluctuates within a specific range on Wednesday, hovering near the 61.8% Fibonacci level.
…
This is a premium post.
[s2If !current_user_can(access_s2member_level4)]Please register for FREE REGISTER to read full post below containing analysis. In case of any error or you think you are not able to read the full post below, please email us at support#nehcap.com [lwa][/s2If] [s2If current_user_can(access_s2member_level1)]
- USD/MXN oscillates in a range on Wednesday, around the 61.8% Fibo. level.
The pair currently trades last at 17.0788.
The previous day high was 17.1424 while the previous day low was 17.0548. The daily 38.2% Fib levels comes at 17.0882, expected to provide resistance. Similarly, the daily 61.8% fib level is at 17.1089, expected to provide resistance.
The USD/MXN remains on the defensive through the Asian session on Wednesday and is currently placed around the 17.0760-17.0755 area, representing the 61.8% Fibonacci retracement level of the rally from the August monthly swing low. Spot prices, however, manage to hold above a two-week low touched on Monday and the 50-day Simple Moving Average (SMA), pegged near the 17.0235 region, which should act as a key pivotal point ahead of the highly-anticipated FOMC monetary policy decision.
Oscillators on the daily chart, meanwhile, have been gaining negative traction and suggest that the path of least resistance for the USD/MXN pair is to the downside. That said, it will still be prudent to wait for a sustained break below the aforementioned support before positioning for further losses. Spot prices might then turn vulnerable to weaken further below the 17.0000 psychological mark and test the 16.8885 support zone. The downward trajectory could get extended further towards the multi-year trough, near the 16.6945 region touched in August.
On the flip side, the overnight swing high, around the 17.1420-17.1425 area now seems to act as an immediate hurdle ahead of the weekly top, near the 17.1825 region touched on Monday. Any subsequent move up is more likely to confront stiff resistance and remain capped near the 17.2060-17.2280 confluence, comprising the 50% Fibo. level and the 100-day SMA. Some follow-through buying, however, should lift the USD/MXN pair to the 38.2% Fibo. level, around the 17.3300 region en route to the 23.6% Fibo. barrier near the 17.4775 area.
The next relevant hurdle is pegged near the multi-month top, around the 17.7090-17.7095 zone, which if cleared decisively will be seen as a fresh trigger for bullish traders and set the stage for a further near-term appreciating move for the USD/MXN pair.
Technical Levels: Supports and Resistances
USDMXN currently trading at 17.0811 at the time of writing. Pair opened at 17.0817 and is trading with a change of -0.0 % .
| Overview | Overview.1 | |
|---|---|---|
| 0 | Today last price | 17.0811 |
| 1 | Today Daily Change | -0.0006 |
| 2 | Today Daily Change % | -0.0000 |
| 3 | Today daily open | 17.0817 |
The pair is trading below its 20 Daily moving average @ 17.1131, above its 50 Daily moving average @ 17.0175 , below its 100 Daily moving average @ 17.2163 and below its 200 Daily moving average @ 17.9303
| Trends | Trends.1 | |
|---|---|---|
| 0 | Daily SMA20 | 17.1131 |
| 1 | Daily SMA50 | 17.0175 |
| 2 | Daily SMA100 | 17.2163 |
| 3 | Daily SMA200 | 17.9303 |
The previous day high was 17.1424 while the previous day low was 17.0548. The daily 38.2% Fib levels comes at 17.0882, expected to provide resistance. Similarly, the daily 61.8% fib level is at 17.1089, expected to provide resistance.
Note the levels of interest below:
- Pivot support is noted at 17.0435, 17.0054, 16.956
- Pivot resistance is noted at 17.1311, 17.1805, 17.2187
| Levels | Levels.1 |
|---|---|
| Previous Daily High | 17.1424 |
| Previous Daily Low | 17.0548 |
| Previous Weekly High | 17.5959 |
| Previous Weekly Low | 17.0504 |
| Previous Monthly High | 17.4274 |
| Previous Monthly Low | 16.6945 |
| Daily Fibonacci 38.2% | 17.0882 |
| Daily Fibonacci 61.8% | 17.1089 |
| Daily Pivot Point S1 | 17.0435 |
| Daily Pivot Point S2 | 17.0054 |
| Daily Pivot Point S3 | 16.9560 |
| Daily Pivot Point R1 | 17.1311 |
| Daily Pivot Point R2 | 17.1805 |
| Daily Pivot Point R3 | 17.2187 |
[/s2If]
Download Nehcap EAWe have two EAs that are operational on our LIVE accounts.
- EA-FIX: Check out the details here. Download EA-FIX . EA-FIX is a non-grid HFT scalper.
- EA-GROWTH: High quality low dd EA using trend grids. Download EA_GROWTHJoin Our Telegram Group


