The price of gold, represented by #XAUUSD, remains steady at $1,930 as investors await the Federal Reserve’s upcoming decision.
…
This is a premium post.
[s2If !current_user_can(access_s2member_level4)]Please register for FREE REGISTER to read full post below containing analysis. In case of any error or you think you are not able to read the full post below, please email us at support#nehcap.com [lwa][/s2If] [s2If current_user_can(access_s2member_level1)]
- Gold price trades sideways around $1,930 as the Fed’s decision looms.
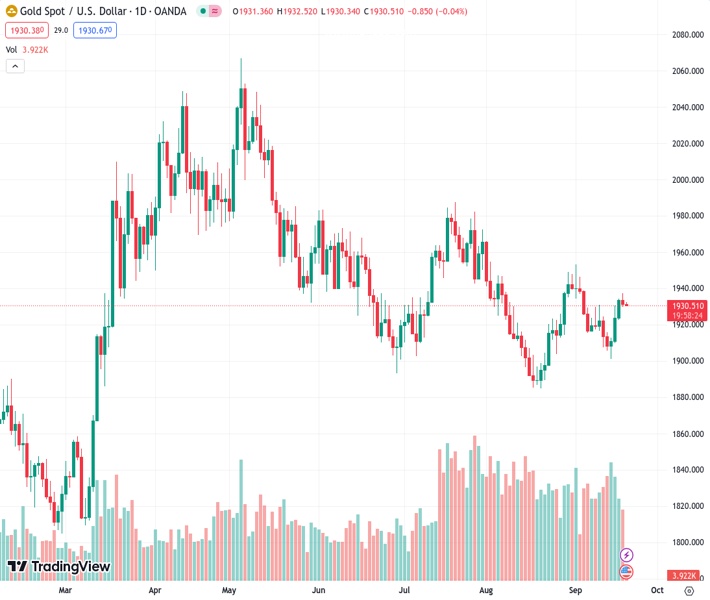
The pair currently trades last at 1930.56.
The previous day high was 1937.44 while the previous day low was 1929.79. The daily 38.2% Fib levels comes at 1932.71, expected to provide resistance. Similarly, the daily 61.8% fib level is at 1934.52, expected to provide resistance.
Gold price consolidates below a two-week high, trading around $1,930 during the early hours of the Asian session on Wednesday. The price of yellow metal is under pressure due to improved US Treasury yields ahead of the US Federal Reserve’s (Fed) decision.
US Dollar Index (DXY) continues to hold steady around 105.10, supported by elevated US Treasury bond yields. The yield on the US 10-year Treasury note is at 4.36% by the press time, marking its highest level in 16 years, which poses a challenge to Gold prices.
Fed is expected to keep rates at the current 5.25%-5.50% range in September but to keep them higher for a prolonged period following the recent data, which showed that inflation is resilient.
According to the CME FedWatch Tool, the probability of another rate hike had been lowered in the November and December meetings.
While the Fed’s decision is significant, market participants will closely focus on the ‘dot plots’ to assess the expected interest rate trajectory. In the most recent Summary of Economic Projections (SEP), the Fed’s median estimates indicate that rates could reach a peak of 5.6%.
According to a report from Reuters, US Treasury Secretary Janet Yellen commented on Tuesday that, given the economy was operating at full employment, it was necessary for US growth to moderate to a rate more aligned with its potential growth rate in order to bring inflation back to target levels.
Yellen also said “I think the Chinese would most likely use the policy space they have to try to avoid a slowdown with major proportions. There may be spillovers from China’s economic difficulties to the US.”
Traders will closely monitor the US Federal Reserve’s meeting decision on Wednesday later in the North American session.
Technical Levels: Supports and Resistances
XAUUSD currently trading at 1930.88 at the time of writing. Pair opened at 1931.38 and is trading with a change of -0.03 % .
| Overview | Overview.1 | |
|---|---|---|
| 0 | Today last price | 1930.88 |
| 1 | Today Daily Change | -0.50 |
| 2 | Today Daily Change % | -0.03 |
| 3 | Today daily open | 1931.38 |
The pair is trading above its 20 Daily moving average @ 1924.58, below its 50 Daily moving average @ 1931.99 , below its 100 Daily moving average @ 1945.57 and above its 200 Daily moving average @ 1923.66
| Trends | Trends.1 | |
|---|---|---|
| 0 | Daily SMA20 | 1924.58 |
| 1 | Daily SMA50 | 1931.99 |
| 2 | Daily SMA100 | 1945.57 |
| 3 | Daily SMA200 | 1923.66 |
The previous day high was 1937.44 while the previous day low was 1929.79. The daily 38.2% Fib levels comes at 1932.71, expected to provide resistance. Similarly, the daily 61.8% fib level is at 1934.52, expected to provide resistance.
Note the levels of interest below:
- Pivot support is noted at 1928.3, 1925.22, 1920.65
- Pivot resistance is noted at 1935.95, 1940.52, 1943.6
| Levels | Levels.1 |
|---|---|
| Previous Daily High | 1937.44 |
| Previous Daily Low | 1929.79 |
| Previous Weekly High | 1930.77 |
| Previous Weekly Low | 1901.07 |
| Previous Monthly High | 1966.08 |
| Previous Monthly Low | 1884.85 |
| Daily Fibonacci 38.2% | 1932.71 |
| Daily Fibonacci 61.8% | 1934.52 |
| Daily Pivot Point S1 | 1928.30 |
| Daily Pivot Point S2 | 1925.22 |
| Daily Pivot Point S3 | 1920.65 |
| Daily Pivot Point R1 | 1935.95 |
| Daily Pivot Point R2 | 1940.52 |
| Daily Pivot Point R3 | 1943.60 |
[/s2If]
Download Nehcap EAWe have two EAs that are operational on our LIVE accounts.
- EA-FIX: Check out the details here. Download EA-FIX . EA-FIX is a non-grid HFT scalper.
- EA-GROWTH: High quality low dd EA using trend grids. Download EA_GROWTHJoin Our Telegram Group


