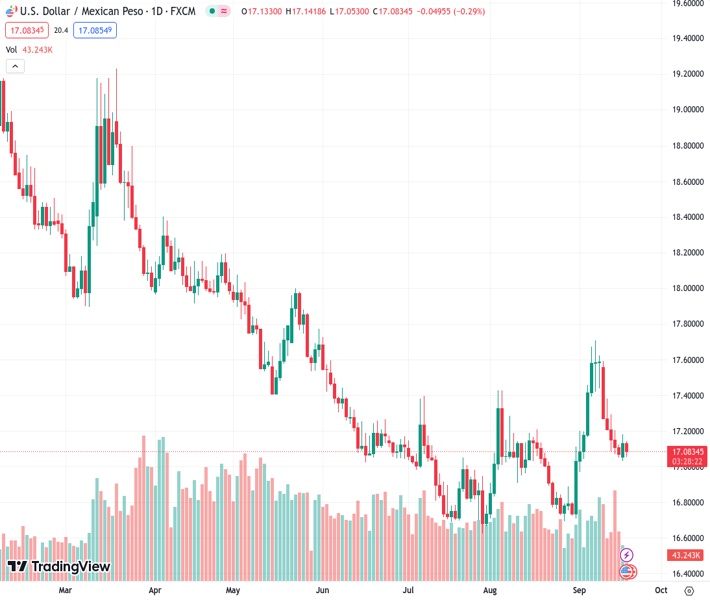
The USDMXN is currently at 17.0685, marking a 0.37% decrease from the previous rate of 17.0874. This decline is due to the recovery of the Mexican Peso, which has regained some of its lost value.
…
This is a premium post.
[s2If !current_user_can(access_s2member_level4)]Please register for FREE REGISTER to read full post below containing analysis. In case of any error or you think you are not able to read the full post below, please email us at support#nehcap.com [lwa][/s2If] [s2If current_user_can(access_s2member_level1)]
- USD/MXN down 0.37%, trading at 17.0685, as the Mexican Peso recovers some of its losses.
The pair currently trades last at 17.0874.
The previous day high was 17.1825 while the previous day low was 17.0304. The daily 38.2% Fib levels comes at 17.1244, expected to provide resistance. Similarly, the daily 61.8% fib level is at 17.0885, expected to provide resistance.
The Mexican Peso (MXN) erases some of its Monday’s losses versus the Greenback (USD) and reclaims the 20-day Moving Average (DMA) despite a firm US Dollar (USD), with traders bracing for tomorrow’s US Federal Reserve’s decision. At the time of writing, the USD/MXN is trading at 17.0685, down 0.37%.
Investor sentiment has turned negative ahead of the Fed meeting. During the last economic projections, the Fed anticipated 1% economic growth, a 4.1% unemployment rate, 3.2% PCE inflation, 3.9% core PCE inflation, and the Federal Funds Rate (FFR) peaking at 5.60%. These projections will be updated and play a crucial role in shaping the Fed’s future policy decisions.
In the meantime, housing data was revealed and came worse than expected. Housing starts slumped 11.3% last month, the lowest level since June 2020. Data for July was revised lower to show starts accelerating to a rate of 1.447 million units instead of the previously reported 1.452 million units. Meanwhile, Building Permits jumped 6.9% above the prior month’s 0.1% expansion, the most significant rise in six months.
Meanwhile, US Treasury bond yields are trading in positive territory, with the 10-year note coupon yielding 4.337% amidst a US 20-year bond auction, while the Greenback, as shown by the US Dollar Index (DXY), is firm at around 105.12.
Across the border, the Mexican economic docket revealed a poll by the Instituto Nacional de Estadisitca Geografia e Informatica (INEGI), which shows the economy likely grew 3.4% in August compared with the same month a year earlier, in a preliminary estimate from the statistics agency.
At the beginning of the week, the USD/MXN could not crack the 100-DMA at 17.2091, opening the door for a pullback, which witnessed the pair breaching the 20-DMA at 17.1075. With that said, and with price action below most Moving Averages, the exotic pair could again test the psychological 17.00 figure. However, it must challenge the 50-DMA at 17..0101 before sliding towards the figure and beyond. For a bullish resumption, the USD/MXN must reclaim the 100-DMA, followed by the 17.5000 figure.
Technical Levels: Supports and Resistances
USDMXN currently trading at 17.1002 at the time of writing. Pair opened at 17.1355 and is trading with a change of -0.21 % .
| Overview | Overview.1 | |
|---|---|---|
| 0 | Today last price | 17.1002 |
| 1 | Today Daily Change | -0.0353 |
| 2 | Today Daily Change % | -0.2100 |
| 3 | Today daily open | 17.1355 |
The pair is trading below its 20 Daily moving average @ 17.1046, above its 50 Daily moving average @ 17.0167 , below its 100 Daily moving average @ 17.2252 and below its 200 Daily moving average @ 17.9425
| Trends | Trends.1 | |
|---|---|---|
| 0 | Daily SMA20 | 17.1046 |
| 1 | Daily SMA50 | 17.0167 |
| 2 | Daily SMA100 | 17.2252 |
| 3 | Daily SMA200 | 17.9425 |
The previous day high was 17.1825 while the previous day low was 17.0304. The daily 38.2% Fib levels comes at 17.1244, expected to provide resistance. Similarly, the daily 61.8% fib level is at 17.0885, expected to provide resistance.
Note the levels of interest below:
- Pivot support is noted at 17.0497, 16.964, 16.8976
- Pivot resistance is noted at 17.2019, 17.2683, 17.354
| Levels | Levels.1 |
|---|---|
| Previous Daily High | 17.1825 |
| Previous Daily Low | 17.0304 |
| Previous Weekly High | 17.5959 |
| Previous Weekly Low | 17.0504 |
| Previous Monthly High | 17.4274 |
| Previous Monthly Low | 16.6945 |
| Daily Fibonacci 38.2% | 17.1244 |
| Daily Fibonacci 61.8% | 17.0885 |
| Daily Pivot Point S1 | 17.0497 |
| Daily Pivot Point S2 | 16.9640 |
| Daily Pivot Point S3 | 16.8976 |
| Daily Pivot Point R1 | 17.2019 |
| Daily Pivot Point R2 | 17.2683 |
| Daily Pivot Point R3 | 17.3540 |
[/s2If]
Download Nehcap EAWe have two EAs that are operational on our LIVE accounts.
- EA-FIX: Check out the details here. Download EA-FIX . EA-FIX is a non-grid HFT scalper.
- EA-GROWTH: High quality low dd EA using trend grids. Download EA_GROWTHJoin Our Telegram Group


