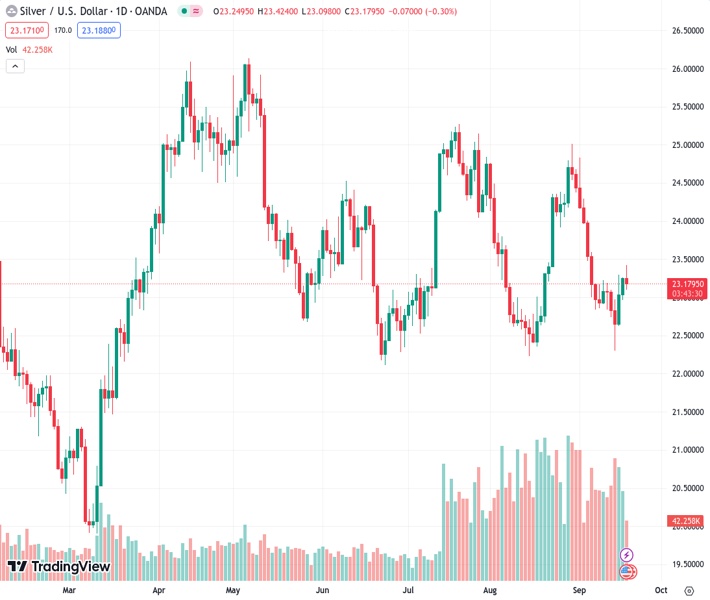
The XAGUSD pair, trading at 23.171, faced a barrier at the 200-day SMA around $23.50 and subsequently dropped to $23.15.
…
This is a premium post.
[s2If !current_user_can(access_s2member_level4)]Please register for FREE REGISTER to read full post below containing analysis. In case of any error or you think you are not able to read the full post below, please email us at support#nehcap.com [lwa][/s2If] [s2If current_user_can(access_s2member_level1)]
- XAG/USD met resistance at the 200-day SMA near $23.50 and then declined to $23.15
The pair currently trades last at 23.171.
The previous day high was 23.26 while the previous day low was 22.96. The daily 38.2% Fib levels comes at 23.15, expected to provide support. Similarly, the daily 61.8% fib level is at 23.08, expected to provide support.
In Tuesday’s session, the Silver Spot price XAG/USD lost momentum and failed to conquer the 200-day Simple Moving Average. The main reason was that the US Treasury yields, often seen as the opportunity cost of holding non-yielding metals, recovered as markets await Wednesday’s Federal Reserve (Fed) decision.
The 10-year bond yield reached 4.34% and trades near the crucial 4.36% threshold, which, in case of breaking it, would set a multi-year high since 2007. In addition, The 2-year yield stands at 5.08% with a 0.52% increase, while the 5-year yield is at 4.48%, up by 0.31%.
For Wednesday’s Federal Reserve (Fed) decisions, despite markets anticipating a pause, a hawkish tone given by Chair Powell could boost US yields and apply further pressure on the grey metal. The US economy remains strong, mainly driven by the Services sector, while the US labour market is showing a mixed picture, and as the Fed want to see a cool down to mitigate inflation risks, it will likely leave the door open for one last hike.
The technical analysis of the daily chart suggests a neutral to bearish stance for XAG/USD as the bears work on staging a recovery. With a downward trend below its midline, the Relative Strength Index (RSI) suggests that the bear’s momentum is strengthening, while the Moving Average Convergence (MACD) exhibits stagnant red bars. Moreover, the pair is below the 20,100 and 200-day Simple Moving Averages (SMAs), implying that the bears retain control on a broader scale, leaving the buyers vulnerable.
Support levels: $23.00, $22.80, $22.50
Resistance levels: $23.50 – 70 (200, 20 and 100-day SMA convergence),$24.00, $24.30
Technical Levels: Supports and Resistances
XAGUSD currently trading at 23.15 at the time of writing. Pair opened at 23.26 and is trading with a change of -0.47 % .
| Overview | Overview.1 | |
|---|---|---|
| 0 | Today last price | 23.15 |
| 1 | Today Daily Change | -0.11 |
| 2 | Today Daily Change % | -0.47 |
| 3 | Today daily open | 23.26 |
The pair remains strongly bearish on the daily time frame. It trades below the 20 SMA @ 23.64, 50 SMA 23.74, 100 SMA @ 23.72 and 200 SMA @ 23.48.
| Trends | Trends.1 | |
|---|---|---|
| 0 | Daily SMA20 | 23.64 |
| 1 | Daily SMA50 | 23.74 |
| 2 | Daily SMA100 | 23.72 |
| 3 | Daily SMA200 | 23.48 |
The previous day high was 23.26 while the previous day low was 22.96. The daily 38.2% Fib levels comes at 23.15, expected to provide support. Similarly, the daily 61.8% fib level is at 23.08, expected to provide support.
Note the levels of interest below:
- Pivot support is noted at 23.06, 22.86, 22.76
- Pivot resistance is noted at 23.36, 23.46, 23.65
| Levels | Levels.1 |
|---|---|
| Previous Daily High | 23.26 |
| Previous Daily Low | 22.96 |
| Previous Weekly High | 23.29 |
| Previous Weekly Low | 22.30 |
| Previous Monthly High | 25.02 |
| Previous Monthly Low | 22.23 |
| Daily Fibonacci 38.2% | 23.15 |
| Daily Fibonacci 61.8% | 23.08 |
| Daily Pivot Point S1 | 23.06 |
| Daily Pivot Point S2 | 22.86 |
| Daily Pivot Point S3 | 22.76 |
| Daily Pivot Point R1 | 23.36 |
| Daily Pivot Point R2 | 23.46 |
| Daily Pivot Point R3 | 23.65 |
[/s2If]
Download Nehcap EAWe have two EAs that are operational on our LIVE accounts.
- EA-FIX: Check out the details here. Download EA-FIX . EA-FIX is a non-grid HFT scalper.
- EA-GROWTH: High quality low dd EA using trend grids. Download EA_GROWTHJoin Our Telegram Group


