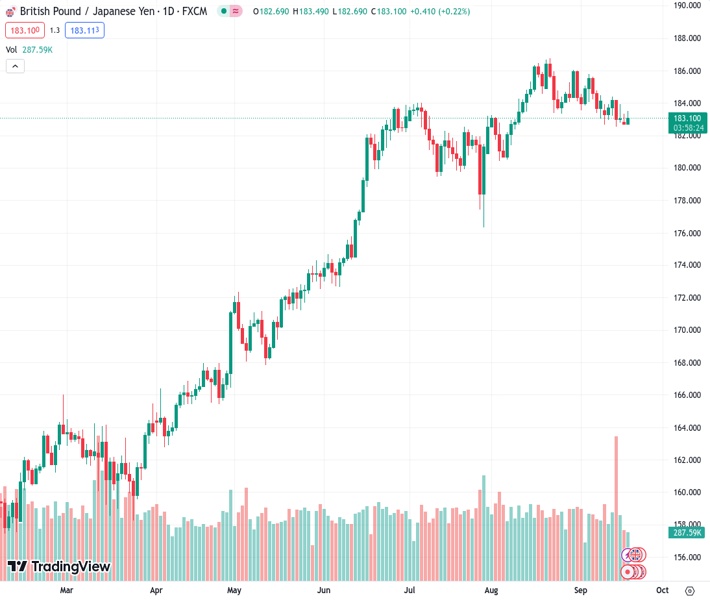
The GBPJPY pair at a price of 183.099 was unable to sustain its upward momentum and is now returning towards the middle of its trading range.
…
This is a premium post.
[s2If !current_user_can(access_s2member_level4)]Please register for FREE REGISTER to read full post below containing analysis. In case of any error or you think you are not able to read the full post below, please email us at support#nehcap.com [lwa][/s2If] [s2If current_user_can(access_s2member_level1)]
- The GBP/JPY couldn’t maintain a bullish push, and is falling back to the midrange.
The pair currently trades last at 183.099.
The previous day high was 183.35 while the previous day low was 182.72. The daily 38.2% Fib levels comes at 182.96, expected to provide support. Similarly, the daily 61.8% fib level is at 183.11, expected to provide resistance.
The GBP/JPY is retesting the 183.00 handle after failing to recapture the 183.50 level in Tuesday trading.
The Pound Sterling (GBP) is trading softly in Tuesday markets, lacking momentum as investors largely sit on the sidelines ahead of this week’s central bank showings.
Late Tuesday will see trade balance figures for Japan, due at 23:50 GMT. Exports and imports are both expected to decline, -1.7% and -19.4% respectively, and the overall Merchandise Trade Balance is forecast to decline ¥-659.1B.
Inflation data is inbound on Wednesday for the United Kingdom (UK), with the Consumer Price Index (CPI) headline for the month of August forecast to tick upwards to 0.7% from the previous month’s 0.4% decline.
The inflation read will serve as a precursor to the Bank of England’s (BoE) showing on Thursday, which is expected to raise rates to 5.5%, a 25-basis-point increase from 5.25%.
Inflation continues to plague the UK even as the British economy continues to wobble, and investors will be keeping a close eye on both inflation figures and the BoE’s Monetary Policy Summary.
The BoE’s rate call and following statement kick off at Thursday at 11:00 GMT.
Friday brings the Bank of Japan’s (BoJ) own interest rate showing, which is broadly expected to maintain their -0.1% negative rate stance. Recent comments from BoJ officials teasing about the possible end of the negative rate regime pushed investors into the bullish camp, but the positioning may have been premature.
Japanese government officials were quick to head off the statements at the pass, noting that BoJ rate hikes would only come if the BoJ were able to hold interest rates above the 2% target mark, a goal that may prove illusory for the BoJ as inflation is expected to slump in Japan.
Friday will also close out the week with Retail Sales figures for the UK. Retail sales figures are forecast to gain 0.5% in August after the previous month’s -1.2% decline.
The Guppy saw a tidy rejection from the 200-hour Simple Moving Average (SMA) in Tuesday trading, sending the pair back into the 183.50 handle after failing to capture 183.50.
Lower highs continue to plague the hourly candlesticks, and the bearish pattern from late August’s high of 186.77 remains intact.
On daily candlesticks the GBP/JPY is struggling to develop momentum, with the pair struggling to make space for itself away from the 34-day Exponential Moving Average (EMA). The 50-day SMA is currently climbing steadily into the 180.00 major psychological handle, and bidders will be looking to keep the pair afloat.
The Guppy has closed in the green for seven of the past eight months, leaving the pair incredibly overbought and exposed to downside shocks if the rug gets pulled out from beneath GBP bulls.
Technical Levels: Supports and Resistances
GBPJPY currently trading at 183.11 at the time of writing. Pair opened at 182.79 and is trading with a change of 0.18 % .
| Overview | Overview.1 | |
|---|---|---|
| 0 | Today last price | 183.11 |
| 1 | Today Daily Change | 0.32 |
| 2 | Today Daily Change % | 0.18 |
| 3 | Today daily open | 182.79 |
The pair is trading below its 20 Daily moving average @ 184.25, below its 50 Daily moving average @ 183.17 , above its 100 Daily moving average @ 179.56 and above its 200 Daily moving average @ 170.93
| Trends | Trends.1 | |
|---|---|---|
| 0 | Daily SMA20 | 184.25 |
| 1 | Daily SMA50 | 183.17 |
| 2 | Daily SMA100 | 179.56 |
| 3 | Daily SMA200 | 170.93 |
The previous day high was 183.35 while the previous day low was 182.72. The daily 38.2% Fib levels comes at 182.96, expected to provide support. Similarly, the daily 61.8% fib level is at 183.11, expected to provide resistance.
Note the levels of interest below:
- Pivot support is noted at 182.56, 182.33, 181.93
- Pivot resistance is noted at 183.18, 183.58, 183.8
| Levels | Levels.1 |
|---|---|
| Previous Daily High | 183.35 |
| Previous Daily Low | 182.72 |
| Previous Weekly High | 184.39 |
| Previous Weekly Low | 182.52 |
| Previous Monthly High | 186.77 |
| Previous Monthly Low | 180.46 |
| Daily Fibonacci 38.2% | 182.96 |
| Daily Fibonacci 61.8% | 183.11 |
| Daily Pivot Point S1 | 182.56 |
| Daily Pivot Point S2 | 182.33 |
| Daily Pivot Point S3 | 181.93 |
| Daily Pivot Point R1 | 183.18 |
| Daily Pivot Point R2 | 183.58 |
| Daily Pivot Point R3 | 183.80 |
[/s2If]
Download Nehcap EAWe have two EAs that are operational on our LIVE accounts.
- EA-FIX: Check out the details here. Download EA-FIX . EA-FIX is a non-grid HFT scalper.
- EA-GROWTH: High quality low dd EA using trend grids. Download EA_GROWTHJoin Our Telegram Group


