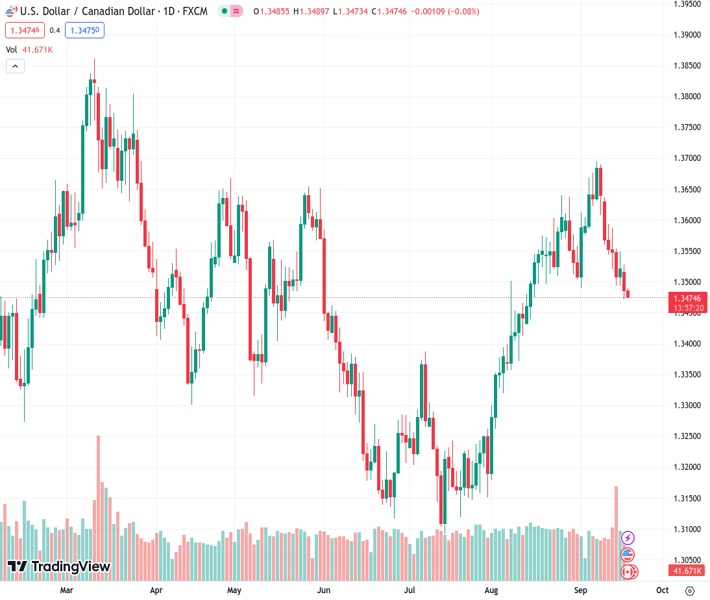
The USDCAD pair is continuing to struggle at around 1.3476, just before the release of Canadian inflation data.
…
This is a premium post.
[s2If !current_user_can(access_s2member_level4)]Please register for FREE REGISTER to read full post below containing analysis. In case of any error or you think you are not able to read the full post below, please email us at support#nehcap.com [lwa][/s2If] [s2If current_user_can(access_s2member_level1)]
- USD/CAD remains on the defensive around 1.3476 ahead of Canadian inflation data.
The pair currently trades last at 1.34756.
The previous day high was 1.3528 while the previous day low was 1.3472. The daily 38.2% Fib levels comes at 1.3493, expected to provide resistance. Similarly, the daily 61.8% fib level is at 1.3507, expected to provide resistance.
The USD/CAD pair remains under selling pressure below the 1.3500 mark during the early European session on Tuesday. A surge in oil price lift the commodity-linked Loonie against the US Dollar (USD). At the press time, the pair is losing 0.07% on the day to trade at 1.3476. Market players await the Canadian Consumer Price Index for August ahead of the highly-anticipated FOMC monetary policy meeting on Wednesday.
According to the one-hour chart, USD/CAD holds below the 50- and 100-hour Exponential Moving Averages (EMAs) with a downward slope, which supports the sellers for the time being. Additionally, the Relative Strength Index (RSI) stands below 50, activating the bearish momentum for the USD/CAD pair for pair.
The critical resistance level for the pair is seen at the 1.3500-1.3510 region, representing the confluence of the 50-hour EMA, psychological round mark, and the upper boundary of the Bollinger Band. Any follow-through buying above the latter will pave the way to the 100-hour EMA at 1.3520. The additional upside filter to watch is near a high of September 13 at 1.3586, followed by a psychological round figure at 1.3600.
Looking at the downside, the lower limit of Bollonger Band at 1.3470 acts as an initial support level for USD/CAD. A breach below the latter will see a drop to 1.3445 (a low of August 15). Further south, the next downside stop is located near a low of August 11 at 1.3412.
Technical Levels: Supports and Resistances
USDCAD currently trading at 1.3475 at the time of writing. Pair opened at 1.3486 and is trading with a change of -0.08 % .
| Overview | Overview.1 | |
|---|---|---|
| 0 | Today last price | 1.3475 |
| 1 | Today Daily Change | -0.0011 |
| 2 | Today Daily Change % | -0.0800 |
| 3 | Today daily open | 1.3486 |
The pair is trading below its 20 Daily moving average @ 1.3572, above its 50 Daily moving average @ 1.3418 , above its 100 Daily moving average @ 1.3402 and above its 200 Daily moving average @ 1.3464
| Trends | Trends.1 | |
|---|---|---|
| 0 | Daily SMA20 | 1.3572 |
| 1 | Daily SMA50 | 1.3418 |
| 2 | Daily SMA100 | 1.3402 |
| 3 | Daily SMA200 | 1.3464 |
The previous day high was 1.3528 while the previous day low was 1.3472. The daily 38.2% Fib levels comes at 1.3493, expected to provide resistance. Similarly, the daily 61.8% fib level is at 1.3507, expected to provide resistance.
Note the levels of interest below:
- Pivot support is noted at 1.3463, 1.3439, 1.3406
- Pivot resistance is noted at 1.3519, 1.3552, 1.3576
| Levels | Levels.1 |
|---|---|
| Previous Daily High | 1.3528 |
| Previous Daily Low | 1.3472 |
| Previous Weekly High | 1.3639 |
| Previous Weekly Low | 1.3493 |
| Previous Monthly High | 1.3640 |
| Previous Monthly Low | 1.3184 |
| Daily Fibonacci 38.2% | 1.3493 |
| Daily Fibonacci 61.8% | 1.3507 |
| Daily Pivot Point S1 | 1.3463 |
| Daily Pivot Point S2 | 1.3439 |
| Daily Pivot Point S3 | 1.3406 |
| Daily Pivot Point R1 | 1.3519 |
| Daily Pivot Point R2 | 1.3552 |
| Daily Pivot Point R3 | 1.3576 |
[/s2If]
Download Nehcap EAWe have two EAs that are operational on our LIVE accounts.
- EA-FIX: Check out the details here. Download EA-FIX . EA-FIX is a non-grid HFT scalper.
- EA-GROWTH: High quality low dd EA using trend grids. Download EA_GROWTHJoin Our Telegram Group


