The AUDUSD pair is moving horizontally at a price of 0.64298 as investors are being careful in anticipation of the Federal Reserve’s policy decision.
…
This is a premium post.
[s2If !current_user_can(access_s2member_level4)]Please register for FREE REGISTER to read full post below containing analysis. In case of any error or you think you are not able to read the full post below, please email us at support#nehcap.com [lwa][/s2If] [s2If current_user_can(access_s2member_level1)]
- AUD/USD trades sideways amid investors exercise caution before Fed policy decision.
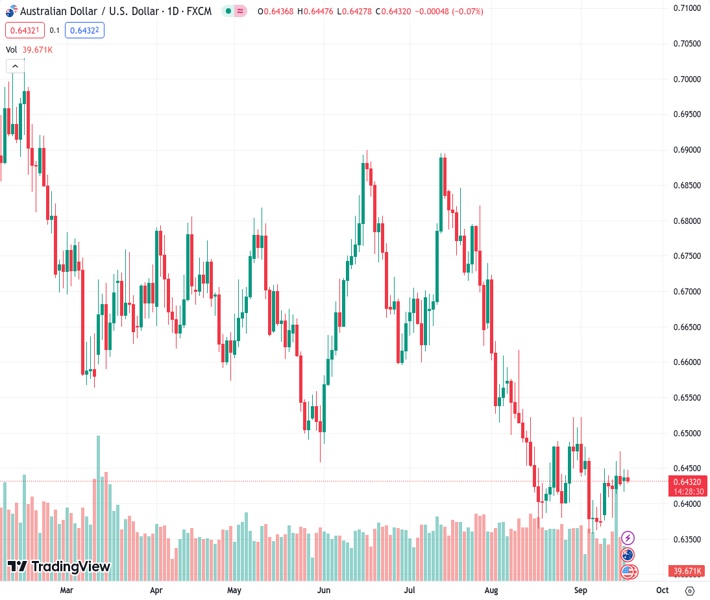
The pair currently trades last at 0.64298.
The previous day high was 0.6449 while the previous day low was 0.6417. The daily 38.2% Fib levels comes at 0.6437, expected to provide resistance. Similarly, the daily 61.8% fib level is at 0.6429, expected to provide support.
AUD/USD continues to move sideways amid investors turn cautious ahead of the US Federal Reserve (Fed) policy decision. The spot price trades around 0.6430 during the Asian session on Tuesday.
The Reserve Bank of Australia (RBA) published its September monetary policy meeting minutes. The RBA did contemplate a 25 basis points rate hike, but ultimately decided to maintain the current interest rate. This decision was driven by the fact that recent economic data did not significantly change the economic outlook.
The minutes from the meeting also indicated that the central bank is prepared to tighten monetary policy further if inflation turns out to be more persistent than anticipated. However, since there were no fresh hawkish signals in the minutes, it could act as an undermining factor for the Australian Dollar (AUD) against the US Dollar (USD).
On the other side, the US Federal Reserve (Fed) is expected to keep its current interest rates in September’s policy meeting, which is exerting pressure on the Greenback. However, investor caution ahead of the policy decision could lend support to the buck. This caution may stem from the possibility of a 25 basis points interest rate hike by the end of 2023.
Traders seem considering the possibility that the Fed may maintain higher interest rates for an extended period due to the resilient incoming macro data and sticky inflation. Market participants will carefully scrutinize the central bank’s statements for any hints or insights into the potential future path of interest rates.
US Dollar Index (DXY) snaps the two-day losing streak, trading higher around 105.20 below a six-month high touched last week. However, US Treasury yields rebound from the previous day’s losses. The yield on the US 10-year bond stands at 4.31% at the time of writing. Improved yields may provide support in underpinning the Greenback.
Investors will likely watch the upcoming macro data from the US, including Building Permits and Housing Starts for August later in the North American session. These datasets may provide a potential impetus for US economic activities, which could be helpful for traders to place fresh bets on the AUD/USD pair.
Technical Levels: Supports and Resistances
AUDUSD currently trading at 0.6432 at the time of writing. Pair opened at 0.6437 and is trading with a change of -0.08 % .
| Overview | Overview.1 | |
|---|---|---|
| 0 | Today last price | 0.6432 |
| 1 | Today Daily Change | -0.0005 |
| 2 | Today Daily Change % | -0.0800 |
| 3 | Today daily open | 0.6437 |
The pair is trading above its 20 Daily moving average @ 0.6431, below its 50 Daily moving average @ 0.6552 , below its 100 Daily moving average @ 0.6615 and below its 200 Daily moving average @ 0.6703
| Trends | Trends.1 | |
|---|---|---|
| 0 | Daily SMA20 | 0.6431 |
| 1 | Daily SMA50 | 0.6552 |
| 2 | Daily SMA100 | 0.6615 |
| 3 | Daily SMA200 | 0.6703 |
The previous day high was 0.6449 while the previous day low was 0.6417. The daily 38.2% Fib levels comes at 0.6437, expected to provide resistance. Similarly, the daily 61.8% fib level is at 0.6429, expected to provide support.
Note the levels of interest below:
- Pivot support is noted at 0.642, 0.6402, 0.6387
- Pivot resistance is noted at 0.6452, 0.6466, 0.6484
| Levels | Levels.1 |
|---|---|
| Previous Daily High | 0.6449 |
| Previous Daily Low | 0.6417 |
| Previous Weekly High | 0.6474 |
| Previous Weekly Low | 0.6378 |
| Previous Monthly High | 0.6724 |
| Previous Monthly Low | 0.6364 |
| Daily Fibonacci 38.2% | 0.6437 |
| Daily Fibonacci 61.8% | 0.6429 |
| Daily Pivot Point S1 | 0.6420 |
| Daily Pivot Point S2 | 0.6402 |
| Daily Pivot Point S3 | 0.6387 |
| Daily Pivot Point R1 | 0.6452 |
| Daily Pivot Point R2 | 0.6466 |
| Daily Pivot Point R3 | 0.6484 |
[/s2If]
Download Nehcap EAWe have two EAs that are operational on our LIVE accounts.
- EA-FIX: Check out the details here. Download EA-FIX . EA-FIX is a non-grid HFT scalper.
- EA-GROWTH: High quality low dd EA using trend grids. Download EA_GROWTHJoin Our Telegram Group


