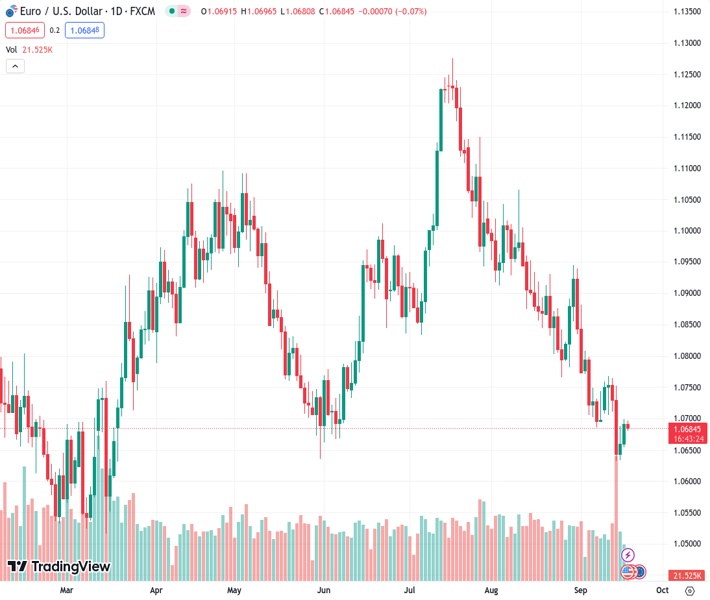
The EURUSD currency pair, currently at a level of 1.06846, is experiencing a decline in its recent gains over the past two days as a result of market apprehension leading up to the decision by the Federal Reserve.
…
This is a premium post.
[s2If !current_user_can(access_s2member_level4)]Please register for FREE REGISTER to read full post below containing analysis. In case of any error or you think you are not able to read the full post below, please email us at support#nehcap.com [lwa][/s2If] [s2If current_user_can(access_s2member_level1)]
- EUR/USD retraces from the two-day gains due to market caution before the Fed decision.
The pair currently trades last at 1.06846.
The previous day high was 1.0699 while the previous day low was 1.0655. The daily 38.2% Fib levels comes at 1.0682, expected to provide support. Similarly, the daily 61.8% fib level is at 1.0672, expected to provide support.
EUR/USD snaps the two-day winning streak, trading lower around 1.0680 during the Asian session on Tuesday. The pair is facing downward pressure due to the market caution ahead of the US Federal Reserve’s (Fed) policy decision.
The data of the Harmonized Index of Consumer Prices (HICP) and Core HICP from the Eurozone is likely to be released later in the day. Investors will observe these datasets, seeking further impetus on the economic situation in the bloc.
The immediate support for the EUR/USD pair appears around the 1.0650 psychological level, followed by the previous week’s low at 1.0631.
If bearish sentiment exerts pressure, the pair could potentially approach the next support level near the 1.0600 psychological level.
On the upside, the EUR/USD pair could face a barrier around the 1.0700 psychological level, lined up with the nine-day Exponential Moving Average (EMA) at 1.0705.
A firm break above the latter could lead the bulls to explore the region around the 14-day EMA at 1.0730, following the 23.6% Fibonacci retracement at 1.0783 level.
The Moving Average Convergence Divergence (MACD) line remains below the centerline, but it exhibits a pattern of convergence beneath the signal line. This pattern implies the potential for a reversal in momentum, indicating that the recent downtrend may be losing strength.
However, traders of the EUR/USD pair will likely observe the 14-day Relative Strength Index (RSI), which indicates bearish momentum in the short term as it lies below the 50 level.
Technical Levels: Supports and Resistances
EURUSD currently trading at 1.0684 at the time of writing. Pair opened at 1.0692 and is trading with a change of -0.07 % .
| Overview | Overview.1 | |
|---|---|---|
| 0 | Today last price | 1.0684 |
| 1 | Today Daily Change | -0.0008 |
| 2 | Today Daily Change % | -0.0700 |
| 3 | Today daily open | 1.0692 |
The pair remains strongly bearish on the daily time frame. It trades below the 20 SMA @ 1.0771, 50 SMA 1.0924, 100 SMA @ 1.0892 and 200 SMA @ 1.0829.
| Trends | Trends.1 | |
|---|---|---|
| 0 | Daily SMA20 | 1.0771 |
| 1 | Daily SMA50 | 1.0924 |
| 2 | Daily SMA100 | 1.0892 |
| 3 | Daily SMA200 | 1.0829 |
The previous day high was 1.0699 while the previous day low was 1.0655. The daily 38.2% Fib levels comes at 1.0682, expected to provide support. Similarly, the daily 61.8% fib level is at 1.0672, expected to provide support.
Note the levels of interest below:
- Pivot support is noted at 1.0665, 1.0638, 1.0621
- Pivot resistance is noted at 1.0709, 1.0726, 1.0753
| Levels | Levels.1 |
|---|---|
| Previous Daily High | 1.0699 |
| Previous Daily Low | 1.0655 |
| Previous Weekly High | 1.0769 |
| Previous Weekly Low | 1.0632 |
| Previous Monthly High | 1.1065 |
| Previous Monthly Low | 1.0766 |
| Daily Fibonacci 38.2% | 1.0682 |
| Daily Fibonacci 61.8% | 1.0672 |
| Daily Pivot Point S1 | 1.0665 |
| Daily Pivot Point S2 | 1.0638 |
| Daily Pivot Point S3 | 1.0621 |
| Daily Pivot Point R1 | 1.0709 |
| Daily Pivot Point R2 | 1.0726 |
| Daily Pivot Point R3 | 1.0753 |
[/s2If]
Download Nehcap EAWe have two EAs that are operational on our LIVE accounts.
- EA-FIX: Check out the details here. Download EA-FIX . EA-FIX is a non-grid HFT scalper.
- EA-GROWTH: High quality low dd EA using trend grids. Download EA_GROWTHJoin Our Telegram Group


