The USDINR currency pair is finding it difficult to make significant progress and instead fluctuates within a certain range on Tuesday.
…
This is a premium post.
[s2If !current_user_can(access_s2member_level4)]Please register for FREE REGISTER to read full post below containing analysis. In case of any error or you think you are not able to read the full post below, please email us at support#nehcap.com [lwa][/s2If] [s2If current_user_can(access_s2member_level1)]
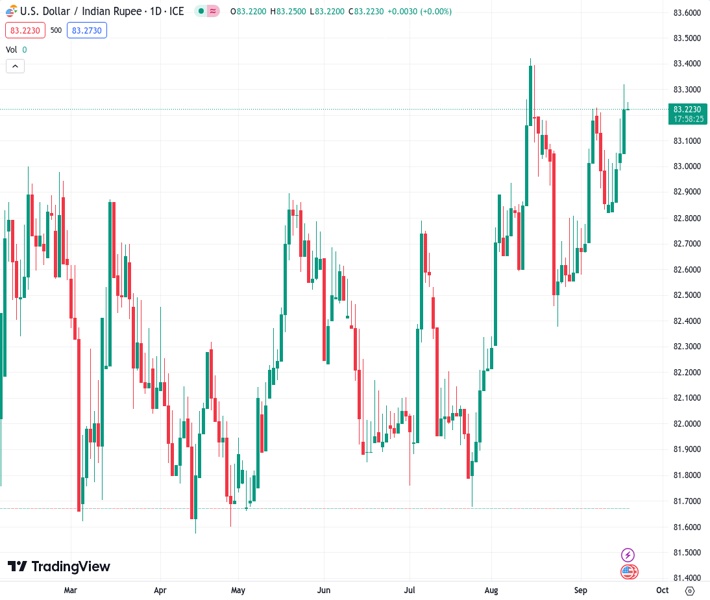
- USD/INR struggles to gain any meaningful traction and oscillates in a range on Tuesday.
The pair currently trades last at 83.2420.
The previous day high was 83.3495 while the previous day low was 83.055. The daily 38.2% Fib levels comes at 83.237, expected to provide support. Similarly, the daily 61.8% fib level is at 83.1675, expected to provide support.
The USD/INR pair oscillates in a range around the 83.20-83.25 area during the Asian session on Tuesday and remains well within the striking distance of over a one-month high touched the previous day. The technical setup, meanwhile, still seems tilted in favour of bullish traders and suggests that the path of least resistance for spot prices is to the upside.
The positive bias is reinforced by the fact that the USD/INR pair is holding comfortably above technically significant 100-day and 200-day Simple Moving Averages (SMAs). Moreover, technical indicators on the daily chart have been gaining some positive traction and are still far from being in the overbought territory. This, in turn, validates the constructive outlook and supports prospects for an extension of the recent upward trajectory witnessed over the past week or so.
Hence, a subsequent strength back towards challenging the all-time high, around the 83.45 region touched in August, looks like a distinct possibility. Some follow-through buying will be seen as a fresh trigger for bulls and allow the USD/INR pair to conquer the 84.00 round-figure mark. Bulls, however, might refrain from placing aggressive bets and prefer to wait on the sidelines ahead of the crucial FOMC monetary policy decision, scheduled to be announced on Wednesday.
On the flip side, any meaningful corrective slide might now find decent support near the 83.00 level and bought into near last week’s swing low, around the 82.80 area. This is followed by the 100-day, currently around the 82.45 region, ahead of the 200-day SMA near the 82.30 zone. A convincing break below the said support levels might prompt some technical selling and make the USD/INR pair vulnerable to accelerate the downward trajectory towards the 82.00 round figure.
The USD/INR pair could slide further towards the July monthly swing low, around the 81.70-81.65 region. Failure to defend the latter will suggest that spot prices have topped out in the near term and pave the way for deeper losses. The pair might then weaken further below the 81.35 intermediate support and eventually drop towards testing sub-81.00 levels.
Technical Levels: Supports and Resistances
USDINR currently trading at 83.2371 at the time of writing. Pair opened at 83.2382 and is trading with a change of -0.0 % .
| Overview | Overview.1 | |
|---|---|---|
| 0 | Today last price | 83.2371 |
| 1 | Today Daily Change | -0.0011 |
| 2 | Today Daily Change % | -0.0000 |
| 3 | Today daily open | 83.2382 |
The pair remains strongly bullish on the daily timeframe. It trades above its 20 SMA @ 82.9017, 50 SMA 82.6816, 100 SMA @ 82.4781 and 200 SMA @ 82.3506.
| Trends | Trends.1 | |
|---|---|---|
| 0 | Daily SMA20 | 82.9017 |
| 1 | Daily SMA50 | 82.6816 |
| 2 | Daily SMA100 | 82.4781 |
| 3 | Daily SMA200 | 82.3506 |
The previous day high was 83.3495 while the previous day low was 83.055. The daily 38.2% Fib levels comes at 83.237, expected to provide support. Similarly, the daily 61.8% fib level is at 83.1675, expected to provide support.
Note the levels of interest below:
- Pivot support is noted at 83.079, 82.9197, 82.7844
- Pivot resistance is noted at 83.3735, 83.5088, 83.6681
| Levels | Levels.1 |
|---|---|
| Previous Daily High | 83.3495 |
| Previous Daily Low | 83.0550 |
| Previous Weekly High | 83.2896 |
| Previous Weekly Low | 82.5035 |
| Previous Monthly High | 83.5505 |
| Previous Monthly Low | 82.2240 |
| Daily Fibonacci 38.2% | 83.2370 |
| Daily Fibonacci 61.8% | 83.1675 |
| Daily Pivot Point S1 | 83.0790 |
| Daily Pivot Point S2 | 82.9197 |
| Daily Pivot Point S3 | 82.7844 |
| Daily Pivot Point R1 | 83.3735 |
| Daily Pivot Point R2 | 83.5088 |
| Daily Pivot Point R3 | 83.6681 |
[/s2If]
Download Nehcap EAWe have two EAs that are operational on our LIVE accounts.
- EA-FIX: Check out the details here. Download EA-FIX . EA-FIX is a non-grid HFT scalper.
- EA-GROWTH: High quality low dd EA using trend grids. Download EA_GROWTHJoin Our Telegram Group


