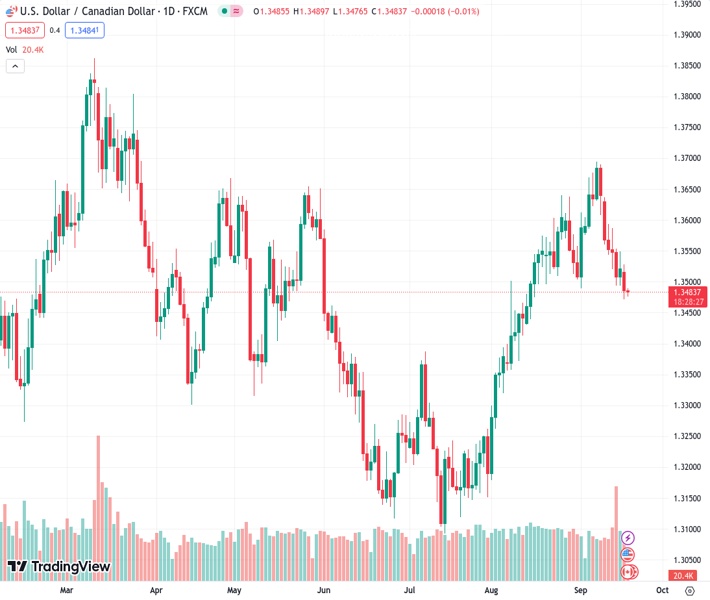
The USDCAD currency pair, currently trading at 1.34824, is experiencing a period of bearish consolidation where it is moving within a range close to its lowest level in the past month.
…
This is a premium post.
[s2If !current_user_can(access_s2member_level4)]Please register for FREE REGISTER to read full post below containing analysis. In case of any error or you think you are not able to read the full post below, please email us at support#nehcap.com [lwa][/s2If] [s2If current_user_can(access_s2member_level1)]
- USD/CAD enters a bearish consolidation phase and oscillates in a range near a one-month low.
The pair currently trades last at 1.34824.
The previous day high was 1.3528 while the previous day low was 1.3472. The daily 38.2% Fib levels comes at 1.3493, expected to provide resistance. Similarly, the daily 61.8% fib level is at 1.3507, expected to provide resistance.
The USD/CAD pair oscillates in a narrow range during the Asian session on Tuesday and consolidates its recent losses to over a one-month low, around 1.3470 region touched the previous day. Spot prices, however, manage to hold above a technically significant 200-day Simple Moving Average (SMA), currently pegged near the 1.3460-1.3455 area, as traders keenly await the outcome of the highly-anticipated FOMC monetary policy meeting.
The Federal Reserve (Fed) is scheduled to announce its decision on Wednesday and is widely anticipated to maintain the status quo, which keeps the US Dollar (USD) depressed below a six-month peak. Meanwhile, Crude Oil prices stand tall near the highest level since November 2022, bolstered by concerns about tighter global supplies and hopes for fuel demand recovery in China – the world’s top Oil importer. This, in turn, continues to underpin the commodity-linked Loonie and acts as a headwind for the USD/CAD pair.
That said, growing acceptance that the Fed will stick to its hawkish stance and keep interest rates higher for longer in the wake of still-sticky inflation. The outlook remains supportive of elevated US Treasury bond yields and helps limit any meaningful downside for the buck. Traders might also prefer to wait for fresh cues about the Fed’s future rate-hike path. Hence, the focus will remain on the ‘dot plot’ and inflation expectations, along with Fed Chair Jerome Powell’s comments at the post-meeting press conference on Wednesday.
In the meantime, traders on Tuesday will look to the latest Canadian consumer inflation figures, due for release later during the early North American session. The US economic docket, meanwhile, features housing market data – Building Permits and Housing Starts. This, along with Oil price dynamics, could allow traders to grab short-term opportunities heading into the key central bank event risk, which will play a key role in driving the USD demand in the near term and determining the next leg of a directional move for the USD/CAD pair.
Technical Levels: Supports and Resistances
USDCAD currently trading at 1.3485 at the time of writing. Pair opened at 1.3486 and is trading with a change of -0.01 % .
| Overview | Overview.1 | |
|---|---|---|
| 0 | Today last price | 1.3485 |
| 1 | Today Daily Change | -0.0001 |
| 2 | Today Daily Change % | -0.0100 |
| 3 | Today daily open | 1.3486 |
The pair is trading below its 20 Daily moving average @ 1.3572, above its 50 Daily moving average @ 1.3418 , above its 100 Daily moving average @ 1.3402 and above its 200 Daily moving average @ 1.3464
| Trends | Trends.1 | |
|---|---|---|
| 0 | Daily SMA20 | 1.3572 |
| 1 | Daily SMA50 | 1.3418 |
| 2 | Daily SMA100 | 1.3402 |
| 3 | Daily SMA200 | 1.3464 |
The previous day high was 1.3528 while the previous day low was 1.3472. The daily 38.2% Fib levels comes at 1.3493, expected to provide resistance. Similarly, the daily 61.8% fib level is at 1.3507, expected to provide resistance.
Note the levels of interest below:
- Pivot support is noted at 1.3463, 1.3439, 1.3406
- Pivot resistance is noted at 1.3519, 1.3552, 1.3576
| Levels | Levels.1 |
|---|---|
| Previous Daily High | 1.3528 |
| Previous Daily Low | 1.3472 |
| Previous Weekly High | 1.3639 |
| Previous Weekly Low | 1.3493 |
| Previous Monthly High | 1.3640 |
| Previous Monthly Low | 1.3184 |
| Daily Fibonacci 38.2% | 1.3493 |
| Daily Fibonacci 61.8% | 1.3507 |
| Daily Pivot Point S1 | 1.3463 |
| Daily Pivot Point S2 | 1.3439 |
| Daily Pivot Point S3 | 1.3406 |
| Daily Pivot Point R1 | 1.3519 |
| Daily Pivot Point R2 | 1.3552 |
| Daily Pivot Point R3 | 1.3576 |
[/s2If]
Download Nehcap EAWe have two EAs that are operational on our LIVE accounts.
- EA-FIX: Check out the details here. Download EA-FIX . EA-FIX is a non-grid HFT scalper.
- EA-GROWTH: High quality low dd EA using trend grids. Download EA_GROWTHJoin Our Telegram Group


