Gold price remains above $1,930 in order to continue its upward trend before important policy decisions are made by major central banks.
…
This is a premium post.
[s2If !current_user_can(access_s2member_level4)]Please register for FREE REGISTER to read full post below containing analysis. In case of any error or you think you are not able to read the full post below, please email us at support#nehcap.com [lwa][/s2If] [s2If current_user_can(access_s2member_level1)]
- Gold price maintains a position above $1,930 to extend gains ahead of policy decisions from major central banks.
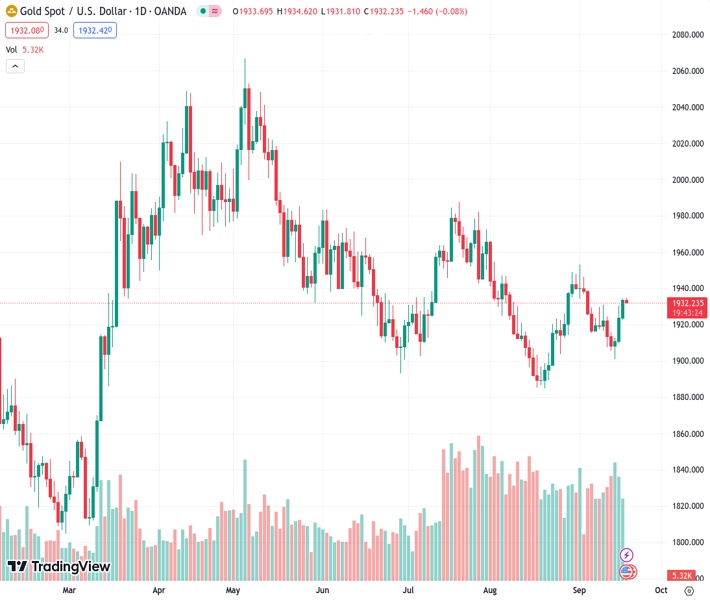
The pair currently trades last at 1932.28.
The previous day high was 1934.32 while the previous day low was 1922.62. The daily 38.2% Fib levels comes at 1929.85, expected to provide support. Similarly, the daily 61.8% fib level is at 1927.09, expected to provide support.
Gold price holds ground to continue the winning streak for the fourth consecutive day, trading around $1,930 during the early trading hours of the Asian session on Tuesday. The pair is facing upward support due to the ahead of the interest rate decisions from the major central banks.
The retracement of the US Dollar (USD) is a significant factor bolstering the price of Gold. The market participants turn cautious following the likelihood of the US Federal Reserve (Fed) to keep interest rates unchanged in the upcoming meeting scheduled for Wednesday. Investors will closely analyze the central bank’s statements, looking for any indications or information regarding potential future interest rate movements.
The markets are factoring in a 25 basis point rate hike by the end of 2023. Additionally, the resilience of recent economic data from the US is bolstering the possibility that the Fed may keep interest rates higher for a prolonged period, which could put a cap on the potential of the yellow metal.
The US Dollar Index (DXY), which assesses the performance of the US Dollar (USD) against six other major currencies, struggles to hold ground at around 105.10 at the time of writing. The US Treasury yields look to extend the losses registered on Monday. The yield on the US 10-year bond has declined to 4.30% by the press time. The downbeat yields are undermining the strength of the Greenback.
Following a similar path as the European Central Bank (ECB) last week, the Bank of England (BoE) is anticipated to implement a cautious 25 basis point interest rate increase in the meeting on Thursday, with a focus on the potential risks associated with stagflation.
Meanwhile, market participants are pricing in the likelihood that the Bank of Japan (BoJ) will continue to maintain its highly accommodative monetary policy stance.
Technical Levels: Supports and Resistances
XAUUSD currently trading at 1932.82 at the time of writing. Pair opened at 1933.82 and is trading with a change of -0.05 % .
| Overview | Overview.1 | |
|---|---|---|
| 0 | Today last price | 1932.82 |
| 1 | Today Daily Change | -1.00 |
| 2 | Today Daily Change % | -0.05 |
| 3 | Today daily open | 1933.82 |
The pair is trading above its 20 Daily moving average @ 1922.88, above its 50 Daily moving average @ 1932.0 , below its 100 Daily moving average @ 1946.42 and above its 200 Daily moving average @ 1922.91
| Trends | Trends.1 | |
|---|---|---|
| 0 | Daily SMA20 | 1922.88 |
| 1 | Daily SMA50 | 1932.00 |
| 2 | Daily SMA100 | 1946.42 |
| 3 | Daily SMA200 | 1922.91 |
The previous day high was 1934.32 while the previous day low was 1922.62. The daily 38.2% Fib levels comes at 1929.85, expected to provide support. Similarly, the daily 61.8% fib level is at 1927.09, expected to provide support.
Note the levels of interest below:
- Pivot support is noted at 1926.19, 1918.55, 1914.49
- Pivot resistance is noted at 1937.89, 1941.95, 1949.59
| Levels | Levels.1 |
|---|---|
| Previous Daily High | 1934.32 |
| Previous Daily Low | 1922.62 |
| Previous Weekly High | 1930.77 |
| Previous Weekly Low | 1901.07 |
| Previous Monthly High | 1966.08 |
| Previous Monthly Low | 1884.85 |
| Daily Fibonacci 38.2% | 1929.85 |
| Daily Fibonacci 61.8% | 1927.09 |
| Daily Pivot Point S1 | 1926.19 |
| Daily Pivot Point S2 | 1918.55 |
| Daily Pivot Point S3 | 1914.49 |
| Daily Pivot Point R1 | 1937.89 |
| Daily Pivot Point R2 | 1941.95 |
| Daily Pivot Point R3 | 1949.59 |
[/s2If]
Download Nehcap EAWe have two EAs that are operational on our LIVE accounts.
- EA-FIX: Check out the details here. Download EA-FIX . EA-FIX is a non-grid HFT scalper.
- EA-GROWTH: High quality low dd EA using trend grids. Download EA_GROWTHJoin Our Telegram Group


