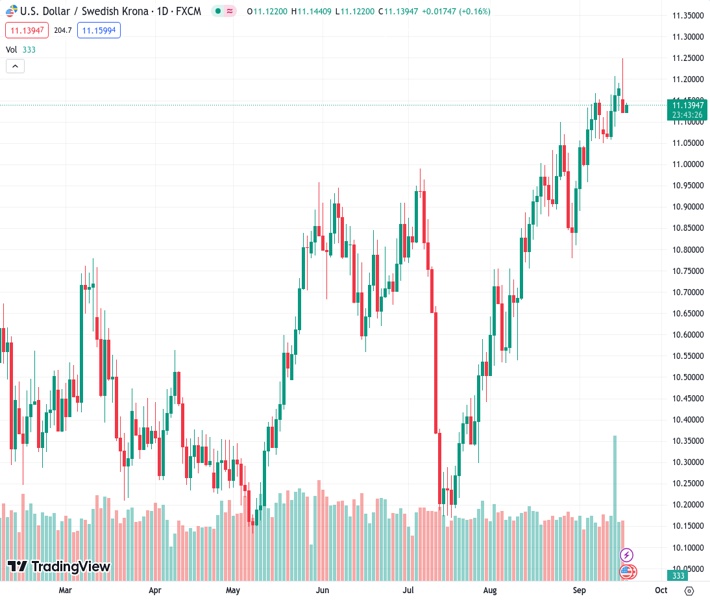
The USDSEK currency pair surged to 11.249, marking its highest level since the beginning of November 2022.
…
This is a premium post.
[s2If !current_user_can(access_s2member_level4)]Please register for FREE REGISTER to read full post below containing analysis. In case of any error or you think you are not able to read the full post below, please email us at support#nehcap.com [lwa][/s2If] [s2If current_user_can(access_s2member_level1)]
- USD/SEK soared to 11.249, its highest since early November 2022.
The pair currently trades last at 11.13969.
The previous day high was 11.206 while the previous day low was 11.1254. The daily 38.2% Fib levels comes at 11.1752, expected to provide resistance. Similarly, the daily 61.8% fib level is at 11.1562, expected to provide resistance.
The USD/SEK saw volatility on Monday, rising to a high since November 4, 2022, then settling at 11.122, securing daily losses. The USD trading somewhat soft, and the Krona holding its ground ahead of one last hike by the Riksbank on Thursday contributed to the pair movements.
In line with that, markets are confident that the Riksbank will deliver its last hike of 25 bps of its tightening cycle to 4%. The Swedish bank will also release updated macro forecasts, and Governor Thedeen will be on the wires on Friday. For the rest of the year, investors are discounting that there won’t be any more hikes and that the policy rate will peak at 4.05% in Q2 2024.
On the Fed’s side, markets practically priced in a pause on Wednesday but a hawkish one. The bank will likely try to convince markets that the policy will still depend on incoming data and will leave the door open for further hikes. In the meantime, according to the CME FedWatch tool, investors are placing 35% odds on one last hike of 25 bps in November or December, but those odds will rise and fall according to the outcome of the incoming data.
In addition, the Fed will release an updated macro forecast and revised dot plot, which will likely set the pace of the USD price dynamics and the expectations for the upcoming meetings.
The daily chart highlights a neutral technical outlook for USD/SEK as signs of bullish exhaustion become evident, but still, the pair remains in multi-month highs. The Relative Strength Index (RSI) indicates a decrease in upward momentum with a negative slope above its midline, while the Moving Average Convergence (MACD) lays out neutral green bars. Furthermore, the pair is above the 20,100,200-day Simple Moving Average (SMA), indicating buyers command the broader perspective.
Support levels: 11.0960, 11.0650, 11.0550.
Resistance levels: 11.175, 11.205, 11.249.
Technical Levels: Supports and Resistances
USDSEK currently trading at 11.151 at the time of writing. Pair opened at 11.2003 and is trading with a change of -0.44 % .
| Overview | Overview.1 | |
|---|---|---|
| 0 | Today last price | 11.1510 |
| 1 | Today Daily Change | -0.0493 |
| 2 | Today Daily Change % | -0.4400 |
| 3 | Today daily open | 11.2003 |
The pair remains strongly bullish on the daily timeframe. It trades above its 20 SMA @ 11.0461, 50 SMA 10.7498, 100 SMA @ 10.7033 and 200 SMA @ 10.5608.
| Trends | Trends.1 | |
|---|---|---|
| 0 | Daily SMA20 | 11.0461 |
| 1 | Daily SMA50 | 10.7498 |
| 2 | Daily SMA100 | 10.7033 |
| 3 | Daily SMA200 | 10.5608 |
The previous day high was 11.206 while the previous day low was 11.1254. The daily 38.2% Fib levels comes at 11.1752, expected to provide resistance. Similarly, the daily 61.8% fib level is at 11.1562, expected to provide resistance.
Note the levels of interest below:
- Pivot support is noted at 11.1485, 11.0967, 11.0679
- Pivot resistance is noted at 11.2291, 11.2578, 11.3096
| Levels | Levels.1 |
|---|---|
| Previous Daily High | 11.2060 |
| Previous Daily Low | 11.1254 |
| Previous Weekly High | 11.2085 |
| Previous Weekly Low | 11.0496 |
| Previous Monthly High | 11.0993 |
| Previous Monthly Low | 10.4126 |
| Daily Fibonacci 38.2% | 11.1752 |
| Daily Fibonacci 61.8% | 11.1562 |
| Daily Pivot Point S1 | 11.1485 |
| Daily Pivot Point S2 | 11.0967 |
| Daily Pivot Point S3 | 11.0679 |
| Daily Pivot Point R1 | 11.2291 |
| Daily Pivot Point R2 | 11.2578 |
| Daily Pivot Point R3 | 11.3096 |
[/s2If]
Download Nehcap EAWe have two EAs that are operational on our LIVE accounts.
- EA-FIX: Check out the details here. Download EA-FIX . EA-FIX is a non-grid HFT scalper.
- EA-GROWTH: High quality low dd EA using trend grids. Download EA_GROWTHJoin Our Telegram Group


