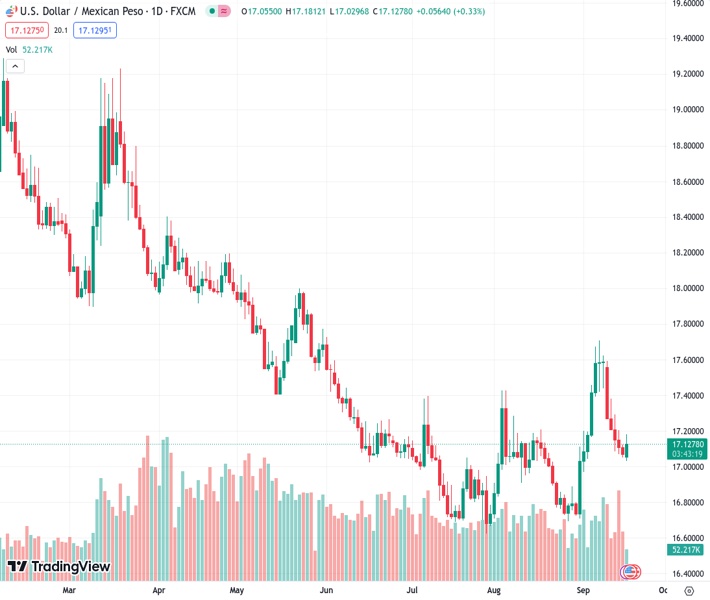
The US dollar to Mexican peso exchange rate, currently at 17.1306, is now trading at 17.1182, recovering from its lowest point of the day at 17.0296. This rebound comes as investors look forward to important monetary policy decisions from central banks throughout this week.
…
This is a premium post.
[s2If !current_user_can(access_s2member_level4)]Please register for FREE REGISTER to read full post below containing analysis. In case of any error or you think you are not able to read the full post below, please email us at support#nehcap.com [lwa][/s2If] [s2If current_user_can(access_s2member_level1)]
- USD/MXN trades at 17.1182, rebounding from a daily low of 17.0296, as markets anticipate key central bank decisions this week.
The pair currently trades last at 17.1306.
The previous day high was 17.1269 while the previous day low was 17.0504. The daily 38.2% Fib levels comes at 17.0796, expected to provide support. Similarly, the daily 61.8% fib level is at 17.0977, expected to provide support.
The Mexican Peso (MXN) loses ground versus the Greenback (USD) on Monday, ahead of a busy week in the central bank space, as three of the most important are set to deliver their decisions. At the time of writing, the USD/MXN is trading at 17.1182 after printing a daily low of 17.0296.
Investors’ mood depreciated the Mexican currency as the US Federal Reserve (Fed) is expected to deliver its decision on Wednesday, at around 18:00 GMT, followed by Jerome Powell’s press conference. According to data, the swaps market sees the Fed holding rates unchanged, at 5.25%-5.50%, thought would likely keep their options open due to last week’s inflation uptick. USD/MXN traders would look at the update of the so-called ‘dot-plots.’
The US economy witnessed a slight jump in consumer and producer price indices. As fewer Americans filed for unemployment benefits, the jobs market remains hot. That was depicted by Retail Sales, which expanded at a slower rate, while consumer sentiment deteriorated, blamed on high gasoline prices. Notably, inflation expectations were pushed lower, as revealed by the University of Michigan.
On the Mexican front, Private Consumption in Mexico grew by 4.3% YoY in Q2 2023, below the previous reading of 4.8%, according to figures revealed by the Instituto Nacional de Estadistica Geografia e Informatica (INEGI).
Sentiment amongst investors improved as Chinese data witnessed the economy has found its bottom after the Government’s efforts to stimulate the economy, which faltered to recover as expected by most financial market analysts.
In the week ahead, the US economic docket will feature housing data, \the Fed’s decision, jobs data, and S&P Global PMIs. Retail Sales are expected to deteriorate on the Mexican front, while inflation for the first half of September is foreseen to slow down.
The pair found its foot at around 17.0297 before testing the 50-day Moving Average (DMA), which has risen above the 20-DMA at 17.0992, exacerbating a test of the 100-DMA at 17.2188. A breach of the latter will expose the 17.50 area, followed by the September 7 swing high at 17.7074. ahead of challenging the 18.0000 psychological level. Conversely, if the pair slides toward the 20-DMA, it could pave the way for a crack under 17.0000. The next support will emerge at August’s 28 daily low of 16.6923.
Technical Levels: Supports and Resistances
USDMXN currently trading at 17.1363 at the time of writing. Pair opened at 17.0782 and is trading with a change of 0.34 % .
| Overview | Overview.1 | |
|---|---|---|
| 0 | Today last price | 17.1363 |
| 1 | Today Daily Change | 0.0581 |
| 2 | Today Daily Change % | 0.3400 |
| 3 | Today daily open | 17.0782 |
The pair is trading above its 20 Daily moving average @ 17.0986, above its 50 Daily moving average @ 17.015 , below its 100 Daily moving average @ 17.2333 and below its 200 Daily moving average @ 17.9561
| Trends | Trends.1 | |
|---|---|---|
| 0 | Daily SMA20 | 17.0986 |
| 1 | Daily SMA50 | 17.0150 |
| 2 | Daily SMA100 | 17.2333 |
| 3 | Daily SMA200 | 17.9561 |
The previous day high was 17.1269 while the previous day low was 17.0504. The daily 38.2% Fib levels comes at 17.0796, expected to provide support. Similarly, the daily 61.8% fib level is at 17.0977, expected to provide support.
Note the levels of interest below:
- Pivot support is noted at 17.0434, 17.0087, 16.9669
- Pivot resistance is noted at 17.1199, 17.1617, 17.1964
| Levels | Levels.1 |
|---|---|
| Previous Daily High | 17.1269 |
| Previous Daily Low | 17.0504 |
| Previous Weekly High | 17.5959 |
| Previous Weekly Low | 17.0504 |
| Previous Monthly High | 17.4274 |
| Previous Monthly Low | 16.6945 |
| Daily Fibonacci 38.2% | 17.0796 |
| Daily Fibonacci 61.8% | 17.0977 |
| Daily Pivot Point S1 | 17.0434 |
| Daily Pivot Point S2 | 17.0087 |
| Daily Pivot Point S3 | 16.9669 |
| Daily Pivot Point R1 | 17.1199 |
| Daily Pivot Point R2 | 17.1617 |
| Daily Pivot Point R3 | 17.1964 |
[/s2If]
Download Nehcap EAWe have two EAs that are operational on our LIVE accounts.
- EA-FIX: Check out the details here. Download EA-FIX . EA-FIX is a non-grid HFT scalper.
- EA-GROWTH: High quality low dd EA using trend grids. Download EA_GROWTHJoin Our Telegram Group


