Oil prices are rapidly increasing due to worries about limited supplies, causing the Canadian dollar to strengthen compared to the US dollar.
…
This is a premium post.
[s2If !current_user_can(access_s2member_level4)]Please register for FREE REGISTER to read full post below containing analysis. In case of any error or you think you are not able to read the full post below, please email us at support#nehcap.com [lwa][/s2If] [s2If current_user_can(access_s2member_level1)]
- Oil prices are surging thanks to ongoing supply constraint concerns, sending the CAD soaring against the USD.
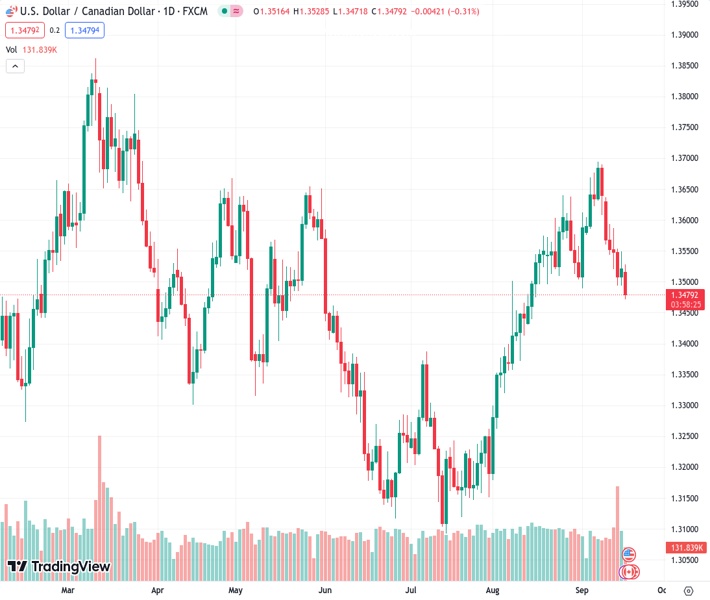
The pair currently trades last at 1.34816.
The previous day high was 1.355 while the previous day low was 1.3494. The daily 38.2% Fib levels comes at 1.3529, expected to provide resistance. Similarly, the daily 61.8% fib level is at 1.3515, expected to provide resistance.
The USD/CAD continues to tip to the downside as the Loonie (CAD) gets pushed higher by rising oil prices.
Oil prices continue to chew through chart paper, with West Texas Intermediary (WTI) US crude oil marking a fresh high of $91/bbl in Monday trading.
The USD/CAD is testing into five-week lows as the US Dollar (USD) gives up ground against the commodity-supported CAD, but the midweek sees the Federal Reserve (Fed) landing with another rate call. Markets are broadly expecting the Federal Open Market Committee (FOMC) to hold steady with interest rates at 5%.
Oil prices will be driving the USD/CAD for the early week, but the economic calendar will see plenty of Greenback-based momentum from Wednesday onwards. However, before any of that can happen, the CAD will see Consumer Price Index (CPI) figures for Canada on Tuesday.
The Canadian CPI is scheduled for 12:30 GMT Tuesday, and is expected to climb to 3.8% from the previous 3.3% as the Bank of Canada (BoC) struggles to contain inflation largely bolstered by rising energy prices.
Thursday will bring US Initial Jobless Claims which lasted printed at 220K, while Friday sees Canadian Retail Sales for July, forecast to tick higher from 0.1% to 0.4%.
US Manufacturing and Services Purchasing Manager Index (PMI) data is also slated for Friday. The Manufacturing PMI is expected to decline slightly from 47.9 to 47.8, while the services component is seen declining from 50.5 to 50.3.
The Dollar-Loonie pairing is trading to the midpoint of familiar territory initially reached in late 2022, and the pair is rapidly approaching the 200-day Simple Moving Average (SMA) near 1.3464 as prices slip past the 34-day Exponential Moving Average (EMA), currently turning bearish into 1.3505.
The Relative Strength Index (RSI) and Moving Average Convergence-Divergence (MACD) indicators are firmly bearish on daily candlesticks, and the indicators are warning buyers that there could still be plenty of room to run towards the downside before a successful bullish offensive can be mounted.
Technical Levels: Supports and Resistances
USDCAD currently trading at 1.3482 at the time of writing. Pair opened at 1.3524 and is trading with a change of -0.31 % .
| Overview | Overview.1 | |
|---|---|---|
| 0 | Today last price | 1.3482 |
| 1 | Today Daily Change | -0.0042 |
| 2 | Today Daily Change % | -0.3100 |
| 3 | Today daily open | 1.3524 |
The pair is trading below its 20 Daily moving average @ 1.3575, above its 50 Daily moving average @ 1.3414 , above its 100 Daily moving average @ 1.3403 and above its 200 Daily moving average @ 1.3465
| Trends | Trends.1 | |
|---|---|---|
| 0 | Daily SMA20 | 1.3575 |
| 1 | Daily SMA50 | 1.3414 |
| 2 | Daily SMA100 | 1.3403 |
| 3 | Daily SMA200 | 1.3465 |
The previous day high was 1.355 while the previous day low was 1.3494. The daily 38.2% Fib levels comes at 1.3529, expected to provide resistance. Similarly, the daily 61.8% fib level is at 1.3515, expected to provide resistance.
Note the levels of interest below:
- Pivot support is noted at 1.3496, 1.3467, 1.344
- Pivot resistance is noted at 1.3551, 1.3578, 1.3607
| Levels | Levels.1 |
|---|---|
| Previous Daily High | 1.3550 |
| Previous Daily Low | 1.3494 |
| Previous Weekly High | 1.3639 |
| Previous Weekly Low | 1.3493 |
| Previous Monthly High | 1.3640 |
| Previous Monthly Low | 1.3184 |
| Daily Fibonacci 38.2% | 1.3529 |
| Daily Fibonacci 61.8% | 1.3515 |
| Daily Pivot Point S1 | 1.3496 |
| Daily Pivot Point S2 | 1.3467 |
| Daily Pivot Point S3 | 1.3440 |
| Daily Pivot Point R1 | 1.3551 |
| Daily Pivot Point R2 | 1.3578 |
| Daily Pivot Point R3 | 1.3607 |
[/s2If]
Download Nehcap EAWe have two EAs that are operational on our LIVE accounts.
- EA-FIX: Check out the details here. Download EA-FIX . EA-FIX is a non-grid HFT scalper.
- EA-GROWTH: High quality low dd EA using trend grids. Download EA_GROWTHJoin Our Telegram Group


