The GBPUSD pair is trading at 1.23959, and it is facing resistance near a significant psychological level. Additionally, there are conflicting predictions from two central banks regarding interest rates.
…
This is a premium post.
[s2If !current_user_can(access_s2member_level4)]Please register for FREE REGISTER to read full post below containing analysis. In case of any error or you think you are not able to read the full post below, please email us at support#nehcap.com [lwa][/s2If] [s2If current_user_can(access_s2member_level1)]
- GBP/USD stuck near major psychological level with dual central bank rate calls in the barrel.
The pair currently trades last at 1.23959.
The previous day high was 1.2446 while the previous day low was 1.2379. The daily 38.2% Fib levels comes at 1.2405, expected to provide resistance. Similarly, the daily 61.8% fib level is at 1.242, expected to provide resistance.
It’s a heavy showing for the GBP/USD pair this week with both the Federal Reserve (Fed) and Bank of England (BoE) on-deck with interest rate calls slated for the midweek, and the Pound Sterling (GBP) is jostling for position against the Greenback (USD) as investors gear their positioning.
The Fed is broadly expected to hold rates steady 5.5% at the upcoming Federal Open Market Committee (FOMC) meeting on Wednesday at 18:00 GMT, while the BoE is forecast to give one last 25-basis-point rate hike, bringing the UK’s main rate to 5.5% from 5.25%.
The BoE’s rate call is slated for 11:00 GMT on Thursday.
It’s a bumper week for the GBP/USD on the economic calendar. For the UK, Consumer Price Index (CPI) numbers print on Wednesday, BoE Thursday, and Friday sees Retail Sales and Preliminary Purchasing Manager Index (PMI) figures.
United Kingdom (UK) CPI figures on Wednesday are expected to increase from -0.4% to 0.7%, while Friday’s Retail Sales for August are likewise forecast to bump to 0.5% after the previous month’s 1.2% decline.
On the United States (US) side of the data docket, Wednesday’s Fed showing will be followed by employment figures on Thursday and the Preliminary PMI printing on Friday.
Thursday’s Initial Jobless Claims for the week into September 15th and the Philadelphia Manufacturing Survey for September are scheduled for 12:30 GMT. Initial Jobless Claims last printed at 220K, and the manufacturing survey is expected to decline 0.7% versus the last showing of 12.
Friday’s preliminary PMI numbers, scheduled for 13:45 GMT, are broadly expected to show a minor slip, with the manufacturing PMI forecast to tick down to 47.8 from the previous 47.9, and the services sector PMI is forecast to move slightly lower from 50.5 to 50.3.
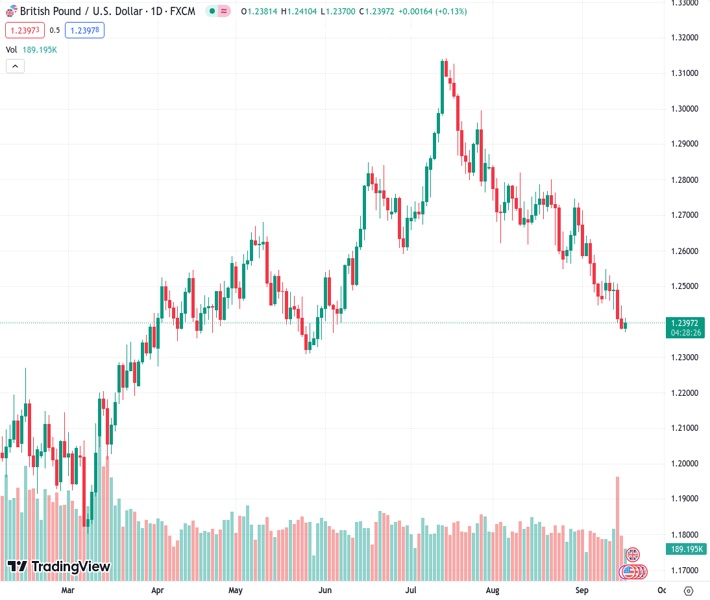
On the technical side, the GBP/USD is knocking sideways in early week trading. The pair opened the week near the 1.2400 handle and has so far struggled to find momentum. The intraday action sees a sideways skid between 1.2400 and 1.2380.
The GBP/USD has closed red or flat for eight of the past nine consecutive weeks from early July’s peak of 1.3142, and Daily candlesticks see the pair decidedly bearish, slipping just below the 200-day Simple Moving Average (SMA) currently parked near 1.2433.
The 34-day Exponential Moving Average (EMA) has turned bearish into the 1.2600 major level, and as long as markets remain on-balance traders will want to keep an eye on the Relative Strength Index (RSI) and Moving Average Convergence-Divergence (MACD) indicators, both of which are flashing oversold conditions on daily candlesticks.
Technical Levels: Supports and Resistances
GBPUSD currently trading at 1.2394 at the time of writing. Pair opened at 1.2383 and is trading with a change of 0.09 % .
| Overview | Overview.1 | |
|---|---|---|
| 0 | Today last price | 1.2394 |
| 1 | Today Daily Change | 0.0011 |
| 2 | Today Daily Change % | 0.0900 |
| 3 | Today daily open | 1.2383 |
The pair remains strongly bearish on the daily time frame. It trades below the 20 SMA @ 1.2577, 50 SMA 1.2733, 100 SMA @ 1.2654 and 200 SMA @ 1.2433.
| Trends | Trends.1 | |
|---|---|---|
| 0 | Daily SMA20 | 1.2577 |
| 1 | Daily SMA50 | 1.2733 |
| 2 | Daily SMA100 | 1.2654 |
| 3 | Daily SMA200 | 1.2433 |
The previous day high was 1.2446 while the previous day low was 1.2379. The daily 38.2% Fib levels comes at 1.2405, expected to provide resistance. Similarly, the daily 61.8% fib level is at 1.242, expected to provide resistance.
Note the levels of interest below:
- Pivot support is noted at 1.2359, 1.2336, 1.2292
- Pivot resistance is noted at 1.2426, 1.247, 1.2494
| Levels | Levels.1 |
|---|---|
| Previous Daily High | 1.2446 |
| Previous Daily Low | 1.2379 |
| Previous Weekly High | 1.2548 |
| Previous Weekly Low | 1.2379 |
| Previous Monthly High | 1.2841 |
| Previous Monthly Low | 1.2548 |
| Daily Fibonacci 38.2% | 1.2405 |
| Daily Fibonacci 61.8% | 1.2420 |
| Daily Pivot Point S1 | 1.2359 |
| Daily Pivot Point S2 | 1.2336 |
| Daily Pivot Point S3 | 1.2292 |
| Daily Pivot Point R1 | 1.2426 |
| Daily Pivot Point R2 | 1.2470 |
| Daily Pivot Point R3 | 1.2494 |
[/s2If]
Download Nehcap EAWe have two EAs that are operational on our LIVE accounts.
- EA-FIX: Check out the details here. Download EA-FIX . EA-FIX is a non-grid HFT scalper.
- EA-GROWTH: High quality low dd EA using trend grids. Download EA_GROWTHJoin Our Telegram Group


