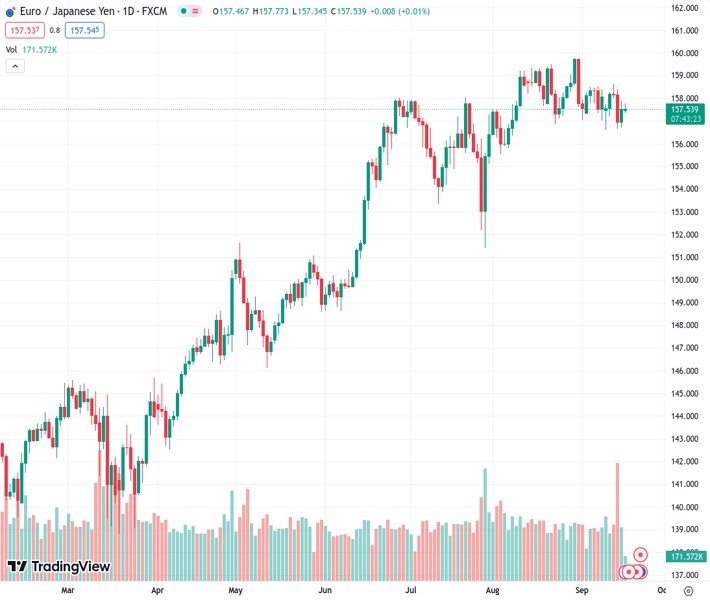
The EURJPY currency pair is currently trading at 157.501 and remains confined within a narrow price range near 157.50.
…
This is a premium post.
[s2If !current_user_can(access_s2member_level4)]Please register for FREE REGISTER to read full post below containing analysis. In case of any error or you think you are not able to read the full post below, please email us at support#nehcap.com [lwa][/s2If] [s2If current_user_can(access_s2member_level1)]
- EUR/JPY trades within a tight range around 157.50.
The pair currently trades last at 157.501.
The previous day high was 157.9 while the previous day low was 156.72. The daily 38.2% Fib levels comes at 157.45, expected to provide support. Similarly, the daily 61.8% fib level is at 157.17, expected to provide support.
EUR/JPY navigates within a tight range above the 157.00 yardstick at the beginning of the week.
In the meantime, the cross continues to face some consolidative range. Against that, a minor hurdle emerges at the so far monthly high of 158.65 (September 13) ahead of the 2023 top at 159.76 (August 30), which precedes the key round level at 160.00. The surpass of the latter should not see any resistance level of note until the 2008 high at 169.96 (July 23).
So far, the longer term positive outlook for the cross appears favoured while above the 200-day SMA, today at 148.77.
Technical Levels: Supports and Resistances
EURJPY currently trading at 157.44 at the time of writing. Pair opened at 157.58 and is trading with a change of -0.09 % .
| Overview | Overview.1 | |
|---|---|---|
| 0 | Today last price | 157.44 |
| 1 | Today Daily Change | 43.00 |
| 2 | Today Daily Change % | -0.09 |
| 3 | Today daily open | 157.58 |
The pair is trading below its 20 Daily moving average @ 158.11, above its 50 Daily moving average @ 157.22 , above its 100 Daily moving average @ 154.49 and above its 200 Daily moving average @ 148.75
| Trends | Trends.1 | |
|---|---|---|
| 0 | Daily SMA20 | 158.11 |
| 1 | Daily SMA50 | 157.22 |
| 2 | Daily SMA100 | 154.49 |
| 3 | Daily SMA200 | 148.75 |
The previous day high was 157.9 while the previous day low was 156.72. The daily 38.2% Fib levels comes at 157.45, expected to provide support. Similarly, the daily 61.8% fib level is at 157.17, expected to provide support.
Note the levels of interest below:
- Pivot support is noted at 156.9, 156.22, 155.73
- Pivot resistance is noted at 158.08, 158.58, 159.26
| Levels | Levels.1 |
|---|---|
| Previous Daily High | 157.90 |
| Previous Daily Low | 156.72 |
| Previous Weekly High | 158.66 |
| Previous Weekly Low | 156.58 |
| Previous Monthly High | 159.76 |
| Previous Monthly Low | 155.53 |
| Daily Fibonacci 38.2% | 157.45 |
| Daily Fibonacci 61.8% | 157.17 |
| Daily Pivot Point S1 | 156.90 |
| Daily Pivot Point S2 | 156.22 |
| Daily Pivot Point S3 | 155.73 |
| Daily Pivot Point R1 | 158.08 |
| Daily Pivot Point R2 | 158.58 |
| Daily Pivot Point R3 | 159.26 |
[/s2If]
Download Nehcap EAWe have two EAs that are operational on our LIVE accounts.
- EA-FIX: Check out the details here. Download EA-FIX . EA-FIX is a non-grid HFT scalper.
- EA-GROWTH: High quality low dd EA using trend grids. Download EA_GROWTHJoin Our Telegram Group


