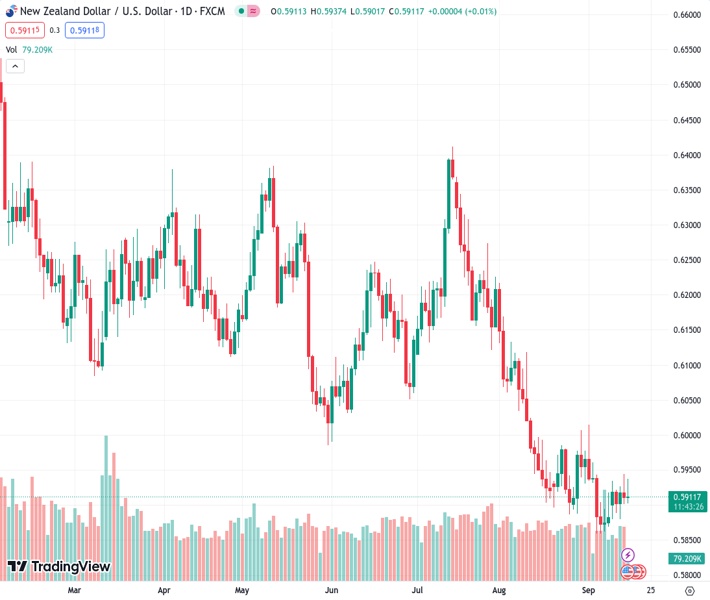
The currency pair NZDUSD, currently at 0.59132, is finding it difficult to maintain its small gains throughout the day, but the potential decrease in value is still restricted.
…
This is a premium post.
[s2If !current_user_can(access_s2member_level4)]Please register for FREE REGISTER to read full post below containing analysis. In case of any error or you think you are not able to read the full post below, please email us at support#nehcap.com [lwa][/s2If] [s2If current_user_can(access_s2member_level1)]
- NZD/USD struggles to preserve its modest intraday gains, though the downside remains limited.
The pair currently trades last at 0.59132.
The previous day high was 0.5945 while the previous day low was 0.5901. The daily 38.2% Fib levels comes at 0.5918, expected to provide resistance. Similarly, the daily 61.8% fib level is at 0.5929, expected to provide resistance.
The NZD/USD pair attracts some sellers following an intraday uptick to the 0.5935 area on Friday and has now surrendered its modest intraday gains. Spot prices, however, manage to hold above the daily trough, around the 59.00 mark, which represents the 200-hour Simple Moving Average (SMA) and should act as a pivotal point for intraday traders.
In the meantime, a generally positive tone around the equity markets, bolstered by more stimulus from China, undermines the safe-haven US Dollar (USD) and should lend some support to the risk-sensitive Kiwi. The People’s Bank of China (PBoC) lowered the Reserve Ratio Requirements for local lenders by 25 bps. This is the second such move this year and is expected to release more liquidity, which should potentially shore up growth in the world’s second-largest economy. Adding to this, China reported better-than-expected Industrial Production and Retail Sales figures for August, which further investors’ appetite for riskier assets.
Despite the aforementioned supporting factors, the NZD/USD pair, so far, has been struggling to gain any meaningful traction. Furthermore, firming expectations that the Federal Reserve (Fed) will stick to its hawkish stance favour the USD bulls. This, in turn, warrants some caution before placing aggressive bullish bets around the pair positioning for an extension of the recent recovery from the 0.5860-0.5855 region, or the YTD low touched last week. The incoming upbeat US macro data continue to point to a resilient economy. This, along with still-sticky inflation, supports prospects for one more 25 bps Fed rate hike move by the end of this year.
Hence, strong follow-through buying beyond the overnight swing high, around the 0.5945 region, is needed to confirm that the NZD/USD pair has formed a near-term bottom. Market participants now look to the US economic docket, featuring the release of the Empire State Manufacturing Index and Prelim Michigan Consumer Sentiment Index later during the early North American session. The data might influence the USD price dynamics, which, along with the broader risk sentiment, should contribute to producing short-term trading opportunities on the last day of the week. Nevertheless, spot prices remain on track to register modest weekly gains.
Technical Levels: Supports and Resistances
NZDUSD currently trading at 0.5914 at the time of writing. Pair opened at 0.5912 and is trading with a change of 0.03 % .
| Overview | Overview.1 | |
|---|---|---|
| 0 | Today last price | 0.5914 |
| 1 | Today Daily Change | 0.0002 |
| 2 | Today Daily Change % | 0.0300 |
| 3 | Today daily open | 0.5912 |
The pair remains strongly bearish on the daily time frame. It trades below the 20 SMA @ 0.5923, 50 SMA 0.606, 100 SMA @ 0.6114 and 200 SMA @ 0.6202.
| Trends | Trends.1 | |
|---|---|---|
| 0 | Daily SMA20 | 0.5923 |
| 1 | Daily SMA50 | 0.6060 |
| 2 | Daily SMA100 | 0.6114 |
| 3 | Daily SMA200 | 0.6202 |
The previous day high was 0.5945 while the previous day low was 0.5901. The daily 38.2% Fib levels comes at 0.5918, expected to provide resistance. Similarly, the daily 61.8% fib level is at 0.5929, expected to provide resistance.
Note the levels of interest below:
- Pivot support is noted at 0.5894, 0.5876, 0.585
- Pivot resistance is noted at 0.5938, 0.5964, 0.5982
| Levels | Levels.1 |
|---|---|
| Previous Daily High | 0.5945 |
| Previous Daily Low | 0.5901 |
| Previous Weekly High | 0.5961 |
| Previous Weekly Low | 0.5847 |
| Previous Monthly High | 0.6219 |
| Previous Monthly Low | 0.5885 |
| Daily Fibonacci 38.2% | 0.5918 |
| Daily Fibonacci 61.8% | 0.5929 |
| Daily Pivot Point S1 | 0.5894 |
| Daily Pivot Point S2 | 0.5876 |
| Daily Pivot Point S3 | 0.5850 |
| Daily Pivot Point R1 | 0.5938 |
| Daily Pivot Point R2 | 0.5964 |
| Daily Pivot Point R3 | 0.5982 |
[/s2If]
Download Nehcap EAWe have two EAs that are operational on our LIVE accounts.
- EA-FIX: Check out the details here. Download EA-FIX . EA-FIX is a non-grid HFT scalper.
- EA-GROWTH: High quality low dd EA using trend grids. Download EA_GROWTHJoin Our Telegram Group


