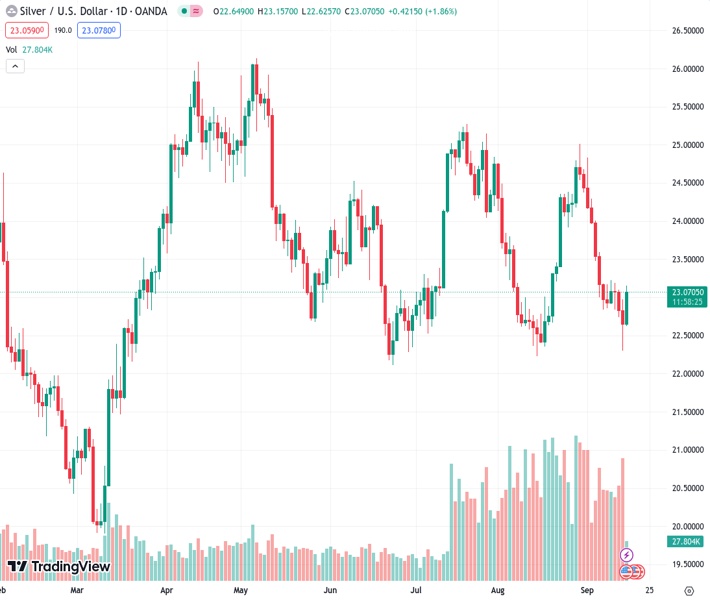
Silver prices rebounded sharply and pulled away from a recent low reached on Thursday, showing significant positive momentum.
…
This is a premium post.
[s2If !current_user_can(access_s2member_level4)]Please register for FREE REGISTER to read full post below containing analysis. In case of any error or you think you are not able to read the full post below, please email us at support#nehcap.com [lwa][/s2If] [s2If current_user_can(access_s2member_level1)]
- Silver gains strong positive traction and moves away from a one-month low touched on Thursday.
The pair currently trades last at 23.066.
The previous day high was 22.98 while the previous day low was 22.3. The daily 38.2% Fib levels comes at 22.56, expected to provide support. Similarly, the daily 61.8% fib level is at 22.72, expected to provide support.
Silver builds on the previous day’s bounce from the $22.30 area – support marked by an ascending trend line extending from the June swing low – and gains strong positive traction on Friday. The momentum lifts the white metal to the top end of its weekly range during the early European session, though struggles to make it through the 200-hour Simple Moving Average (SMA) resistance near the $23.15-$23.20 region.
Technical indicators on the daily chart, meanwhile, are yet to confirm a bullish bias and make it prudent to wait for a sustained strength beyond the aforementioned barrier before placing fresh bullish bets. The XAG/USD might then aim to challenge the very important 200-day SMA, currently around the $23.45 region, en route to the 100-day SMA, near the $23.80 region. This is followed by the $24.00 mark, which if cleared will set the stage for additional gains.
The next relevant hurdle is pegged near the $24.30-$24.35 region, above which the XAG/USD could aim towards reclaiming the $25.00 psychological mark. The latter coincides with the August monthly swing high and should act as a pivotal point. Some follow-through buying, leading to subsequent gains beyond the July peak, around the $25.25 region, will shift the near-term bias in favour of bullish traders and should pave the way for a further appreciating move.
On the flip side, the $22.80 area now seems to protect the immediate downside ahead of the $23.30 region, or a nearly one-month low touched on Thursday. A convincing break below will be seen as a fresh trigger for bearish traders and make the XAG/USD vulnerable to resume its downfall witnessed since the beginning of this month. The subsequent slide has the potential to drag the white metal to the next relevant support near the $21.25 zone en route to the $21.00 mark.
Technical Levels: Supports and Resistances
XAGUSD currently trading at 23.05 at the time of writing. Pair opened at 22.65 and is trading with a change of 1.77 % .
| Overview | Overview.1 | |
|---|---|---|
| 0 | Today last price | 23.05 |
| 1 | Today Daily Change | 0.40 |
| 2 | Today Daily Change % | 1.77 |
| 3 | Today daily open | 22.65 |
The pair remains strongly bearish on the daily time frame. It trades below the 20 SMA @ 23.63, 50 SMA 23.74, 100 SMA @ 23.76 and 200 SMA @ 23.48.
| Trends | Trends.1 | |
|---|---|---|
| 0 | Daily SMA20 | 23.63 |
| 1 | Daily SMA50 | 23.74 |
| 2 | Daily SMA100 | 23.76 |
| 3 | Daily SMA200 | 23.48 |
The previous day high was 22.98 while the previous day low was 22.3. The daily 38.2% Fib levels comes at 22.56, expected to provide support. Similarly, the daily 61.8% fib level is at 22.72, expected to provide support.
Note the levels of interest below:
- Pivot support is noted at 22.31, 21.97, 21.63
- Pivot resistance is noted at 22.99, 23.32, 23.67
| Levels | Levels.1 |
|---|---|
| Previous Daily High | 22.98 |
| Previous Daily Low | 22.30 |
| Previous Weekly High | 24.30 |
| Previous Weekly Low | 22.83 |
| Previous Monthly High | 25.02 |
| Previous Monthly Low | 22.23 |
| Daily Fibonacci 38.2% | 22.56 |
| Daily Fibonacci 61.8% | 22.72 |
| Daily Pivot Point S1 | 22.31 |
| Daily Pivot Point S2 | 21.97 |
| Daily Pivot Point S3 | 21.63 |
| Daily Pivot Point R1 | 22.99 |
| Daily Pivot Point R2 | 23.32 |
| Daily Pivot Point R3 | 23.67 |
[/s2If]
Download Nehcap EAWe have two EAs that are operational on our LIVE accounts.
- EA-FIX: Check out the details here. Download EA-FIX . EA-FIX is a non-grid HFT scalper.
- EA-GROWTH: High quality low dd EA using trend grids. Download EA_GROWTHJoin Our Telegram Group


