After China’s encouraging data and new fiscal stimulus, the price of gold, represented by #XAUUSD, experiences a boost.
…
This is a premium post.
[s2If !current_user_can(access_s2member_level4)]Please register for FREE REGISTER to read full post below containing analysis. In case of any error or you think you are not able to read the full post below, please email us at support#nehcap.com [lwa][/s2If] [s2If current_user_can(access_s2member_level1)]
- Gold price strengthens after China’s positive data and fresh fiscal stimulus.
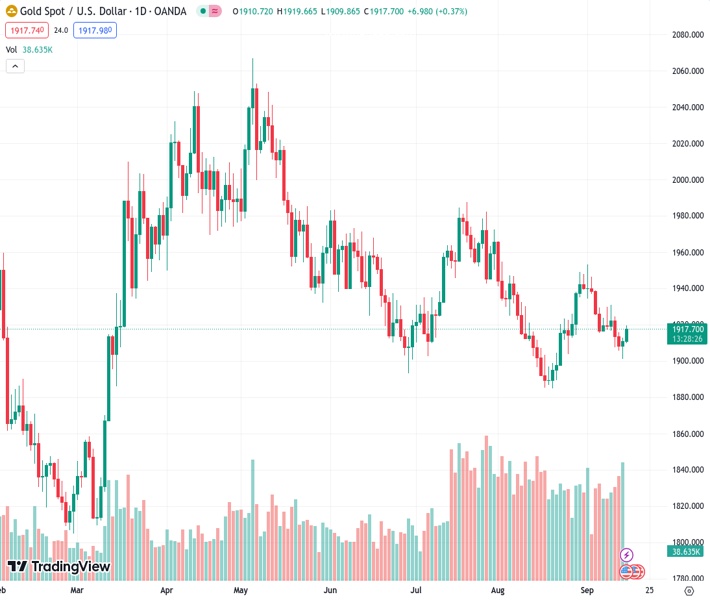
The pair currently trades last at 1917.82.
The previous day high was 1912.95 while the previous day low was 1901.07. The daily 38.2% Fib levels comes at 1908.41, expected to provide support. Similarly, the daily 61.8% fib level is at 1905.61, expected to provide support.
Gold price extends gains on the second day, trading higher near $1,920 per troy ounce during the early trading hours of the European session on Friday. The pair is receiving upward support, likely attributed to a slight correction in the US Dollar (USD).
Additionally, the positive data released by the National Bureau of Statistics (NBS) in China reveals encouraging economic trends. The market optimism could provide support in underpinning the prices of Gold, coupled with the recent move by the People’s Bank of China (PBoC) to lower the Reserve Requirement Ratio (RRR) by 25 basis points (bps).
China’s Retail Sales (YoY) grew by 4.6%, surpassing expectations of a 3.0% increase in August and demonstrating an improvement from the previous month’s 2.5% figure. Moreover, Industrial Production outperformed estimates by showing a growth rate of 4.5% in August, compared to a 3.7% rise in July.
US Dollar Index (DXY) has retreated from its recent six-month high, trading lower around 105.20. However, the likelihood of a substantial corrective decline in the Greenback seems restricted, largely due to market participants being cautious in response to the US Federal Reserve’s (Fed) hawkish stance on monetary policy.
Furthermore, the US Treasury yields recovered the intraday losses, with the yield on 10-year US bond at 4.30% by the press time. The improved yields could provide support for the USD.
The anticipation of the Fed’s dedication to a more stringent monetary policy, potentially involving additional interest rate hikes or tightening measures, is expected to discourage traders from placing bold positions on non-yield assets like yellow metal. Monetary policy decisions and the Fed’s communications will remain focal points for buck movements in the near term.
Moreover, recent economic data from the United States has been generally positive. Initial Jobless Claims for the week ending September 8 were better than anticipated, with 220,000 new claimants. The report showed a slight improvement from the previous week’s figure of 217,000.
Core Producer Price Index (PPI) for August matched expectations with a 2.2% increase, although it was slightly lower than the previous rate of a 2.4% hike. Retail Sales also exhibited improvement, rising to 0.6% compared to the previous month’s 0.5%, surpassing market expectations that had predicted a slowdown to 0.2%.
These data figures collectively suggest a relatively healthy economic environment in the US, which can have an impact on market sentiment and influence trading decisions.
Market participants will closely monitor the release of the US preliminary Michigan Consumer Sentiment Index during the North American session. The consensus expectation is for a minor decline from a reading of 69.1 to 69.5.
Technical Levels: Supports and Resistances
XAUUSD currently trading at 1916.32 at the time of writing. Pair opened at 1910.79 and is trading with a change of 0.29 % .
| Overview | Overview.1 | |
|---|---|---|
| 0 | Today last price | 1916.32 |
| 1 | Today Daily Change | 5.53 |
| 2 | Today Daily Change % | 0.29 |
| 3 | Today daily open | 1910.79 |
The pair remains strongly bearish on the daily time frame. It trades below the 20 SMA @ 1919.22, 50 SMA 1931.85, 100 SMA @ 1947.57 and 200 SMA @ 1921.54.
| Trends | Trends.1 | |
|---|---|---|
| 0 | Daily SMA20 | 1919.22 |
| 1 | Daily SMA50 | 1931.85 |
| 2 | Daily SMA100 | 1947.57 |
| 3 | Daily SMA200 | 1921.54 |
The previous day high was 1912.95 while the previous day low was 1901.07. The daily 38.2% Fib levels comes at 1908.41, expected to provide support. Similarly, the daily 61.8% fib level is at 1905.61, expected to provide support.
Note the levels of interest below:
- Pivot support is noted at 1903.59, 1896.39, 1891.71
- Pivot resistance is noted at 1915.47, 1920.15, 1927.35
| Levels | Levels.1 |
|---|---|
| Previous Daily High | 1912.95 |
| Previous Daily Low | 1901.07 |
| Previous Weekly High | 1946.35 |
| Previous Weekly Low | 1915.33 |
| Previous Monthly High | 1966.08 |
| Previous Monthly Low | 1884.85 |
| Daily Fibonacci 38.2% | 1908.41 |
| Daily Fibonacci 61.8% | 1905.61 |
| Daily Pivot Point S1 | 1903.59 |
| Daily Pivot Point S2 | 1896.39 |
| Daily Pivot Point S3 | 1891.71 |
| Daily Pivot Point R1 | 1915.47 |
| Daily Pivot Point R2 | 1920.15 |
| Daily Pivot Point R3 | 1927.35 |
[/s2If]
Download Nehcap EAWe have two EAs that are operational on our LIVE accounts.
- EA-FIX: Check out the details here. Download EA-FIX . EA-FIX is a non-grid HFT scalper.
- EA-GROWTH: High quality low dd EA using trend grids. Download EA_GROWTHJoin Our Telegram Group


