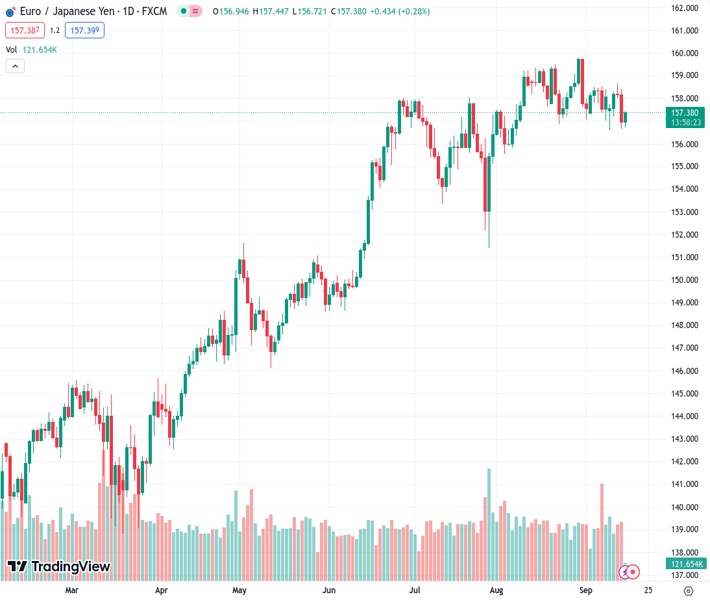
The EURJPY pair, currently trading at 157.377, is starting to gain momentum around the 147.40 level due to increased demand for the Euro.
…
This is a premium post.
[s2If !current_user_can(access_s2member_level4)]Please register for FREE REGISTER to read full post below containing analysis. In case of any error or you think you are not able to read the full post below, please email us at support#nehcap.com [lwa][/s2If] [s2If current_user_can(access_s2member_level1)]
- EUR/JPY gains traction around 147.40 amid the Euro demand.
The pair currently trades last at 157.377.
The previous day high was 158.42 while the previous day low was 156.64. The daily 38.2% Fib levels comes at 157.32, expected to provide support. Similarly, the daily 61.8% fib level is at 157.74, expected to provide resistance.
The EUR/JPY pair gains momentum near 157.40 during the early European session on Friday. Market players await the second-tier economic data release from the Eurozone ahead of the European Central Bank (ECB)’s President Christine Lagarde speech.
According to the one-hour chart, EUR/JPY holds below the 50- and 100-hour Exponential Moving Averages (EMAs), which means further downside looks favorable. However, the Relative Strength Index (RSI) stands above 50, within bullish territory, suggesting that buyers will likely retain control soon.
Therefore, the cross could meet the immediate resistance level near the 50-hour EMA at 157.50. The key barrier is located at 157.65, representing the 100-hour EMA and the upper boundary of the Bollinger Band. The additional upside filter to watch is 158.00 (a psychological round mark and a low of September 13), followed by 158.52 (a high of September 7).
On the downside, the cross will see an initial support level at 156.63 (a low of September 14). Any follow-through selling will see a drop to the lower limit of the Bollinger Band at 156.45. Further south, the cross will see the next contention level at 156.00, highlighting a psychological round figure and a low of August 7. Finally, the downside stop to watch at 155.85 (a low of August 3).
Technical Levels: Supports and Resistances
EURJPY currently trading at 157.42 at the time of writing. Pair opened at 156.96 and is trading with a change of 0.29 % .
| Overview | Overview.1 | |
|---|---|---|
| 0 | Today last price | 157.42 |
| 1 | Today Daily Change | 0.46 |
| 2 | Today Daily Change % | 0.29 |
| 3 | Today daily open | 156.96 |
The pair is trading below its 20 Daily moving average @ 158.13, above its 50 Daily moving average @ 157.18 , above its 100 Daily moving average @ 154.42 and above its 200 Daily moving average @ 148.68
| Trends | Trends.1 | |
|---|---|---|
| 0 | Daily SMA20 | 158.13 |
| 1 | Daily SMA50 | 157.18 |
| 2 | Daily SMA100 | 154.42 |
| 3 | Daily SMA200 | 148.68 |
The previous day high was 158.42 while the previous day low was 156.64. The daily 38.2% Fib levels comes at 157.32, expected to provide support. Similarly, the daily 61.8% fib level is at 157.74, expected to provide resistance.
Note the levels of interest below:
- Pivot support is noted at 156.26, 155.56, 154.48
- Pivot resistance is noted at 158.04, 159.12, 159.82
| Levels | Levels.1 |
|---|---|
| Previous Daily High | 158.42 |
| Previous Daily Low | 156.64 |
| Previous Weekly High | 158.52 |
| Previous Weekly Low | 157.00 |
| Previous Monthly High | 159.76 |
| Previous Monthly Low | 155.53 |
| Daily Fibonacci 38.2% | 157.32 |
| Daily Fibonacci 61.8% | 157.74 |
| Daily Pivot Point S1 | 156.26 |
| Daily Pivot Point S2 | 155.56 |
| Daily Pivot Point S3 | 154.48 |
| Daily Pivot Point R1 | 158.04 |
| Daily Pivot Point R2 | 159.12 |
| Daily Pivot Point R3 | 159.82 |
[/s2If]
Download Nehcap EAWe have two EAs that are operational on our LIVE accounts.
- EA-FIX: Check out the details here. Download EA-FIX . EA-FIX is a non-grid HFT scalper.
- EA-GROWTH: High quality low dd EA using trend grids. Download EA_GROWTHJoin Our Telegram Group


