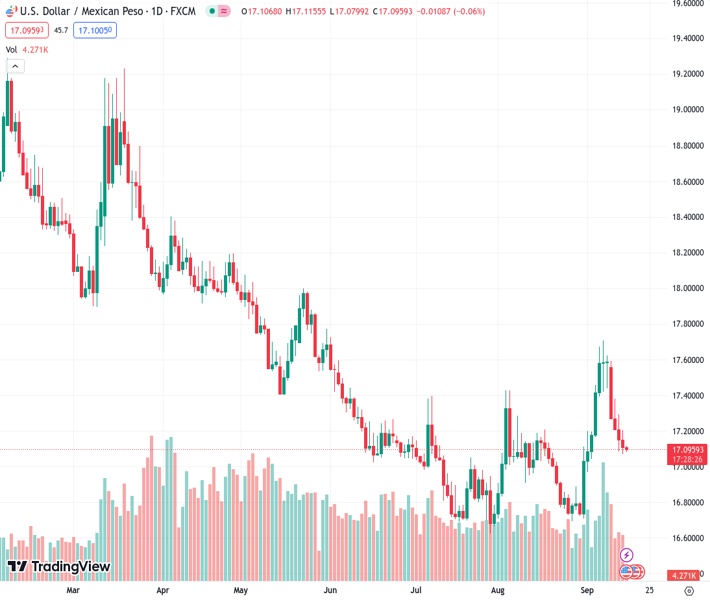
The USDMXN exchange rate of 17.0935 continues to stay at a low level close to the lowest point it reached in the past 1.5 weeks, which occurred on Thursday.
…
This is a premium post.
[s2If !current_user_can(access_s2member_level4)]Please register for FREE REGISTER to read full post below containing analysis. In case of any error or you think you are not able to read the full post below, please email us at support#nehcap.com [lwa][/s2If] [s2If current_user_can(access_s2member_level1)]
- USD/MXN remains depressed near a one-and-half-week low touched on Thursday.
The pair currently trades last at 17.0935.
The previous day high was 17.209 while the previous day low was 17.0734. The daily 38.2% Fib levels comes at 17.1252, expected to provide resistance. Similarly, the daily 61.8% fib level is at 17.1572, expected to provide resistance.
The USD/MXN pair struggles to gain any meaningful traction during the Asian session on Friday and languishes near the 17.10-17.05 region, or a one-and-half-week low touched the previous day.
The aforementioned area represents the 61.8% Fibonacci retracement level of the rally from the August monthly swing low, which should now act as a key pivotal point for intraday traders. Meanwhile, technical indicators on the daily chart have just started drifting in the negative territory and support prospects for an extension of the USD/MXN pair’s downfall witnessed over the past week or so.
That said, it will still be prudent to wait for a convincing break below the 50-day Simple Moving Average (SMA), around the 17.00 mark, before positioning for a further depreciating move. Spot prices might then weaken below the 16.90 intermediate support and challenge a multi-year low, near the 16.70 area touched in August. Some follow-through selling will be seen as a fresh trigger for bearish traders.
On the flip side, any meaningful recovery might now confront stiff resistance and remain capped near the 17.20-17.25 confluence, comprising the 50% Fibo. level and the 100-day SMA. The next relevant hurdle is pegged near the 38.2% Fibo. level, around the 17.35 region, above which the USD/MXN could surpass the 23.6% Fibo. barrier near the 17.45-17.50 barrier and retest the multi-month top, around the 17.70 zone.
Technical Levels: Supports and Resistances
USDMXN currently trading at 17.0982 at the time of writing. Pair opened at 17.1102 and is trading with a change of -0.07 % .
| Overview | Overview.1 | |
|---|---|---|
| 0 | Today last price | 17.0982 |
| 1 | Today Daily Change | -0.0120 |
| 2 | Today Daily Change % | -0.0700 |
| 3 | Today daily open | 17.1102 |
The pair is trading above its 20 Daily moving average @ 17.0975, above its 50 Daily moving average @ 17.0163 , below its 100 Daily moving average @ 17.2425 and below its 200 Daily moving average @ 17.9696
| Trends | Trends.1 | |
|---|---|---|
| 0 | Daily SMA20 | 17.0975 |
| 1 | Daily SMA50 | 17.0163 |
| 2 | Daily SMA100 | 17.2425 |
| 3 | Daily SMA200 | 17.9696 |
The previous day high was 17.209 while the previous day low was 17.0734. The daily 38.2% Fib levels comes at 17.1252, expected to provide resistance. Similarly, the daily 61.8% fib level is at 17.1572, expected to provide resistance.
Note the levels of interest below:
- Pivot support is noted at 17.0527, 16.9952, 16.9171
- Pivot resistance is noted at 17.1883, 17.2664, 17.3239
| Levels | Levels.1 |
|---|---|
| Previous Daily High | 17.2090 |
| Previous Daily Low | 17.0734 |
| Previous Weekly High | 17.7094 |
| Previous Weekly Low | 17.0447 |
| Previous Monthly High | 17.4274 |
| Previous Monthly Low | 16.6945 |
| Daily Fibonacci 38.2% | 17.1252 |
| Daily Fibonacci 61.8% | 17.1572 |
| Daily Pivot Point S1 | 17.0527 |
| Daily Pivot Point S2 | 16.9952 |
| Daily Pivot Point S3 | 16.9171 |
| Daily Pivot Point R1 | 17.1883 |
| Daily Pivot Point R2 | 17.2664 |
| Daily Pivot Point R3 | 17.3239 |
[/s2If]
Download Nehcap EAWe have two EAs that are operational on our LIVE accounts.
- EA-FIX: Check out the details here. Download EA-FIX . EA-FIX is a non-grid HFT scalper.
- EA-GROWTH: High quality low dd EA using trend grids. Download EA_GROWTHJoin Our Telegram Group


