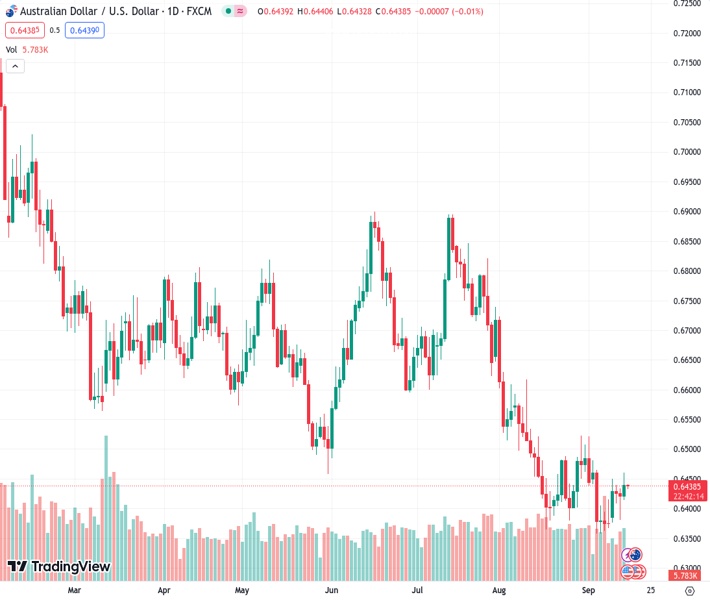
The Australian dollar to US dollar exchange rate has increased by 0.28% at a value of 0.64384. This rise is attributed to strong economic data from the US, such as a 1.6% year-on-year increase in the Producer Price Index (PPI) and better-than-anticipated Retail Sales.
…
This is a premium post.
[s2If !current_user_can(access_s2member_level4)]Please register for FREE REGISTER to read full post below containing analysis. In case of any error or you think you are not able to read the full post below, please email us at support#nehcap.com [lwa][/s2If] [s2If current_user_can(access_s2member_level1)]
- AUD/USD gains 0.28% on robust US economic data, including a PPI jump of 1.6% YoY and better-than-expected Retail Sales.
The pair currently trades last at 0.64384.
The previous day high was 0.6434 while the previous day low was 0.638. The daily 38.2% Fib levels comes at 0.6401, expected to provide support. Similarly, the daily 61.8% fib level is at 0.6414, expected to provide support.
The AUD/USD enjoyed a good uptick in Thursday’s session, supported by solid economic data from the United States (US) despite a solid Aussie’s jobs report. However, the pair ended with gains of 0.28%, and as the Asian session began, it exchanges hands at 0.6436, registering minuscule losses of 0.05%.
The economy in the US remains resilient, as shown by the latest week’s figures, with consumer inflation climbing as expected, which would keep the Federal Reserve vigilant of upcoming economic developments. Thursday’s data revealed that August’s Producer Price Index (PPI) jumped by 0.7% MoM and 1.6% YoY, exceeding the consensus, while Retail Sales grew by 0.6% MoM, above estimates of 0.2%.
In other data, the labor market remains tight, as revealed by Initial Jobless Claims for the last week, showing 220K people filed for unemployment insurance, below the street’s consensus of 225K.
Although the data supports another rate hike by the Fed, market participants remain hesitant to adopt a stance, as shown by the CME FedWatch Tool. Odds for a 25 bps rate hike by the Fed peaked at around 35% for the November meeting, but it’s too early to declare victory. Given that data remained volatile during the last two months, the Fed would have to dig into additional data before deciding the best path of monetary policy.
Regarding the released data in the US, ANZ analysts expect no more hikes by the Fed. They wrote, “Our view is the Fed is done with its tightening cycle, but risks remain that further rises may be needed. We continue to see Fed policy as highly data dependent, at the same time patient, with most officials open to further rate hikes if appropriate.”
Aside from this, employment data in Australia was solid and spurred a leg-up in the AUD/USD pair during Thursday’s Asian session, reversed with the US economic data release. The Aussie economy created 64.9K jobs while the unemployment rate remained at 3.7%. Even though more jobs were added than foreseen, ANZ analysts noted that they expect the Reserve Bank of Australia (RBA) to hold rates unchanged at 4.10%.
Therefore, if the RBA is set to keep rates unchanged and the Fed maintains its options open, additional AUD/USD downside could be expected, with interest rates favoring the Greenback (USD).
Given the fundamental backdrop, from a technical standpoint, the pair could be testing the year-to-date (YTD) low of 0.6357. A breach of the latter would expose key last year’s support levels at a November 22 low of 0.6272, followed by the October 21 swing low at 0.6210.
Technical Levels: Supports and Resistances
AUDUSD currently trading at 0.6437 at the time of writing. Pair opened at 0.6422 and is trading with a change of 0.23 % .
| Overview | Overview.1 | |
|---|---|---|
| 0 | Today last price | 0.6437 |
| 1 | Today Daily Change | 0.0015 |
| 2 | Today Daily Change % | 0.2300 |
| 3 | Today daily open | 0.6422 |
The pair is trading above its 20 Daily moving average @ 0.6427, below its 50 Daily moving average @ 0.6566 , below its 100 Daily moving average @ 0.6621 and below its 200 Daily moving average @ 0.6708
| Trends | Trends.1 | |
|---|---|---|
| 0 | Daily SMA20 | 0.6427 |
| 1 | Daily SMA50 | 0.6566 |
| 2 | Daily SMA100 | 0.6621 |
| 3 | Daily SMA200 | 0.6708 |
The previous day high was 0.6434 while the previous day low was 0.638. The daily 38.2% Fib levels comes at 0.6401, expected to provide support. Similarly, the daily 61.8% fib level is at 0.6414, expected to provide support.
Note the levels of interest below:
- Pivot support is noted at 0.639, 0.6358, 0.6336
- Pivot resistance is noted at 0.6444, 0.6466, 0.6498
| Levels | Levels.1 |
|---|---|
| Previous Daily High | 0.6434 |
| Previous Daily Low | 0.6380 |
| Previous Weekly High | 0.6480 |
| Previous Weekly Low | 0.6357 |
| Previous Monthly High | 0.6724 |
| Previous Monthly Low | 0.6364 |
| Daily Fibonacci 38.2% | 0.6401 |
| Daily Fibonacci 61.8% | 0.6414 |
| Daily Pivot Point S1 | 0.6390 |
| Daily Pivot Point S2 | 0.6358 |
| Daily Pivot Point S3 | 0.6336 |
| Daily Pivot Point R1 | 0.6444 |
| Daily Pivot Point R2 | 0.6466 |
| Daily Pivot Point R3 | 0.6498 |
[/s2If]
Download Nehcap EAWe have two EAs that are operational on our LIVE accounts.
- EA-FIX: Check out the details here. Download EA-FIX . EA-FIX is a non-grid HFT scalper.
- EA-GROWTH: High quality low dd EA using trend grids. Download EA_GROWTHJoin Our Telegram Group


