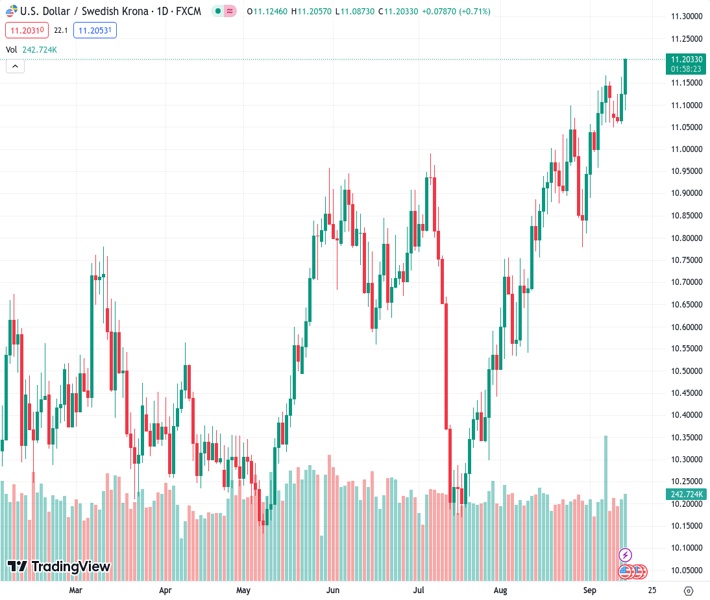
The USDSEK rose by over 0.60% to reach 11.2000, which is its highest level since November 2022.
…
This is a premium post.
[s2If !current_user_can(access_s2member_level4)]Please register for FREE REGISTER to read full post below containing analysis. In case of any error or you think you are not able to read the full post below, please email us at support#nehcap.com [lwa][/s2If] [s2If current_user_can(access_s2member_level1)]
- USD/SEK increased more than 0.60% towards 11.2000, its highest since November 2022.
The pair currently trades last at 11.20209.
The previous day high was 11.1694 while the previous day low was 11.0588. The daily 38.2% Fib levels comes at 11.1271, expected to provide support. Similarly, the daily 61.8% fib level is at 11.101, expected to provide support.
The USD/SEK tallied a fresh multi-month high around 11.2000 as the SEK lost interest following soft inflation figures from Sweden from August. On the other hand, the Greenback continues to trade strong, with its DXY advancing to highs since March 9 after positive mid-tier economic figures were released.
On the Swedish front, headline Consumer Price Index (CPI) inflation in August was registered at 7.5% YoY, slightly below the expected 7.7%. In addition, the Consumer Price Index with a Fixed Interest Rate (CPIF) ex-energy came in at 7.2% YoY vs. 7.4% and lower than the previous 8.0% reading. Despite soft inflation figures, the SEK’s losses may be cushioned by the Riskbank’s hawkish stance as it hinted in its last meeting that it will hike one more time in 2023, as the weakness of its currency contributes to inflationary pressures. In that sense, a hike to 4% is priced in for next week’s meeting.
On the other hand, the US economy doesn’t cool down and continues to report strong data. The Producer Price Index (PPI) surged by 0.7% MoM, leading to a 1.6% YoY increase, surpassing predictions. Retail Sales also demonstrated strength, posting a 0.6% MoM growth, well above the expected 0.2% rise. Meanwhile, during the second week of September, Jobless Claims increased to 220,000, slightly exceeding the previous week’s 217,000 but staying below the anticipated 225,000. Focus now shifts to next week’s Federal Reserve (Fed) decision, where investors will look for clues to continue modelling their expectations in the policy statement and Chair Powell’s presser. As for now, the CME FedWatch tool indicates that the odds of one last 25 basis point (bps) hike have slightly declined to nearly 35%.
Observing the daily chart, USD/SEK suggests a bullish sentiment for the near future. Relative Strength Index (RSI) remains in the positive zone above its midline, showing an upward slope. Concurrently, the Moving Average Convergence Divergence (MACD) reflects encouraging green bars, reinforcing the growing bullish momentum and both indicators are about to reach overbought conditions, which could fuel a downward correction in the near term. Furthermore, the pair is above the 20,100,200-day Simple Moving Average (SMA), highlighting the continued dominance of bulls on the broader scale.
Support levels: 11.0960, 11.0650, 11.0550.
Resistance levels: 11.2300, 11.2400, 11.2940.
Technical Levels: Supports and Resistances
USDSEK currently trading at 11.1972 at the time of writing. Pair opened at 11.1321 and is trading with a change of 0.58 % .
| Overview | Overview.1 | |
|---|---|---|
| 0 | Today last price | 11.1972 |
| 1 | Today Daily Change | 0.0651 |
| 2 | Today Daily Change % | 0.5800 |
| 3 | Today daily open | 11.1321 |
The pair remains strongly bullish on the daily timeframe. It trades above its 20 SMA @ 11.0228, 50 SMA 10.7376, 100 SMA @ 10.685 and 200 SMA @ 10.5522.
| Trends | Trends.1 | |
|---|---|---|
| 0 | Daily SMA20 | 11.0228 |
| 1 | Daily SMA50 | 10.7376 |
| 2 | Daily SMA100 | 10.6850 |
| 3 | Daily SMA200 | 10.5522 |
The previous day high was 11.1694 while the previous day low was 11.0588. The daily 38.2% Fib levels comes at 11.1271, expected to provide support. Similarly, the daily 61.8% fib level is at 11.101, expected to provide support.
Note the levels of interest below:
- Pivot support is noted at 11.0708, 11.0095, 10.9603
- Pivot resistance is noted at 11.1814, 11.2306, 11.2919
| Levels | Levels.1 |
|---|---|
| Previous Daily High | 11.1694 |
| Previous Daily Low | 11.0588 |
| Previous Weekly High | 11.1683 |
| Previous Weekly Low | 10.9291 |
| Previous Monthly High | 11.0993 |
| Previous Monthly Low | 10.4126 |
| Daily Fibonacci 38.2% | 11.1271 |
| Daily Fibonacci 61.8% | 11.1010 |
| Daily Pivot Point S1 | 11.0708 |
| Daily Pivot Point S2 | 11.0095 |
| Daily Pivot Point S3 | 10.9603 |
| Daily Pivot Point R1 | 11.1814 |
| Daily Pivot Point R2 | 11.2306 |
| Daily Pivot Point R3 | 11.2919 |
[/s2If]
Download Nehcap EAWe have two EAs that are operational on our LIVE accounts.
- EA-FIX: Check out the details here. Download EA-FIX . EA-FIX is a non-grid HFT scalper.
- EA-GROWTH: High quality low dd EA using trend grids. Download EA_GROWTHJoin Our Telegram Group


