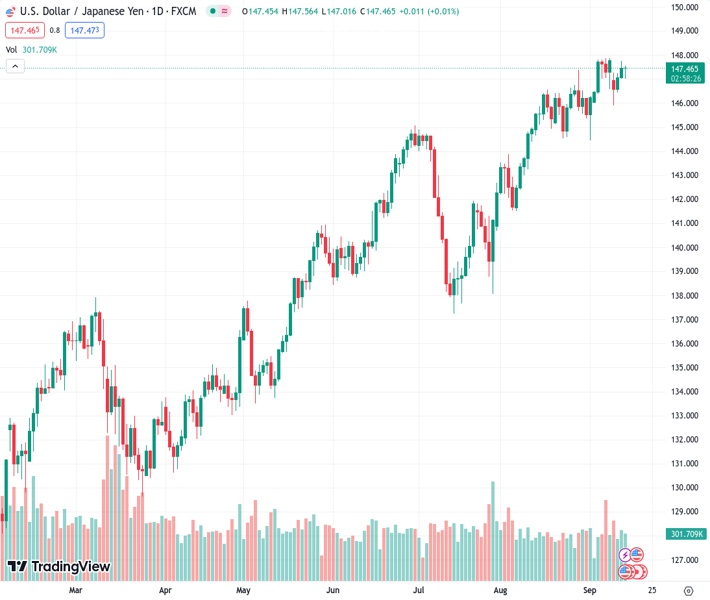
The currency pair USDJPY dropped to approximately 147.00 but later bounced back to 147.40.
…
This is a premium post.
[s2If !current_user_can(access_s2member_level4)]Please register for FREE REGISTER to read full post below containing analysis. In case of any error or you think you are not able to read the full post below, please email us at support#nehcap.com [lwa][/s2If] [s2If current_user_can(access_s2member_level1)]
- USD/JPY declined to a low near 147.00 and then recovered to 147.40.
The pair currently trades last at 147.429.
The previous day high was 147.74 while the previous day low was 147.02. The daily 38.2% Fib levels comes at 147.47, expected to provide resistance. Similarly, the daily 61.8% fib level is at 147.29, expected to provide support.
In Thursday’s session, the USD/JPY saw losses, mainly driven by the JPY’s strength, which is trading strong against most of its rivals. In addition, the Greenback is also holding strong, with its DXY index jumping to its highest level since March 9, around 105.20. The upward movements were driven by solid economic activity figures, which showed that the US economy is not giving up.
The US Producer Price Index (PPI) exhibited a substantial MoM increase of 0.7%, reaching 1.6% (YoY) in August, which exceeded market expectations. On the other hand, Retail Sales saw a 0.6% (MoM) increase in the same month, significantly surpassing the anticipated 0.2% rise and exceeding the previous month’s 0.6% growth.
On the labour market front, Jobless Claims for the second week of September experienced an uptick, reaching 220,000, slightly higher than the previous week’s 217,000 but still below the anticipated figure of 225,000.
As a reaction, the US yields are rising. The 10-year bond yield reached 4.29% and showed a 0.80% increase. The 2-year yield stands at 5.01%, up by 0.76%, while the 5-year yield is at 4.41% with similar increases. However, the CME FedWatch tool indicates that investors foresee a lower likelihood of the Federal Reserve (Fed) opting for a hike in the remainder of 2023, with the odds of a 25 basis point (bps) hike slightly declining to 35%. For the next sessions, the market’s mood will potentially be cautious, awaiting the anticipated Fed decision next Wednesday.
On the JPY’s front, there are no fundamental reasons for the Yen to recover as soft Japanese data make the Bank of Japan’s officials attach to its dovish stance. In line with that, during the Asian session, soft Machinery Orders figures from August from Japan were reported and fell to their lowest since August 2020. The BoJ has stated that as long as wage and inflation figures don’t match their forecast, a pivot won’t be considered, which leaves the Yen vulnerable.
Based on the daily chart, the USD/JPY shows indications of bullish exhaustion, leading to a neutral to bearish technical outlook. With a flat slope above its midline, the Relative Strength Index (RSI) suggests a period of stability in positive territory. At the same time, the Moving Average Convergence (MACD) histogram lays out rising red bars.
Support levels: 146.50 (20-day SMA), 146.00, 145.50.
Resistance levels: 147.50, 148.00, 148.50.
Technical Levels: Supports and Resistances
USDJPY currently trading at 147.41 at the time of writing. Pair opened at 147.46 and is trading with a change of -0.03 % .
| Overview | Overview.1 | |
|---|---|---|
| 0 | Today last price | 147.41 |
| 1 | Today Daily Change | -0.05 |
| 2 | Today Daily Change % | -0.03 |
| 3 | Today daily open | 147.46 |
The pair remains strongly bullish on the daily timeframe. It trades above its 20 SMA @ 146.45, 50 SMA 143.69, 100 SMA @ 141.57 and 200 SMA @ 137.24.
| Trends | Trends.1 | |
|---|---|---|
| 0 | Daily SMA20 | 146.45 |
| 1 | Daily SMA50 | 143.69 |
| 2 | Daily SMA100 | 141.57 |
| 3 | Daily SMA200 | 137.24 |
The previous day high was 147.74 while the previous day low was 147.02. The daily 38.2% Fib levels comes at 147.47, expected to provide resistance. Similarly, the daily 61.8% fib level is at 147.29, expected to provide support.
Note the levels of interest below:
- Pivot support is noted at 147.07, 146.68, 146.34
- Pivot resistance is noted at 147.8, 148.13, 148.52
| Levels | Levels.1 |
|---|---|
| Previous Daily High | 147.74 |
| Previous Daily Low | 147.02 |
| Previous Weekly High | 147.88 |
| Previous Weekly Low | 146.02 |
| Previous Monthly High | 147.38 |
| Previous Monthly Low | 141.51 |
| Daily Fibonacci 38.2% | 147.47 |
| Daily Fibonacci 61.8% | 147.29 |
| Daily Pivot Point S1 | 147.07 |
| Daily Pivot Point S2 | 146.68 |
| Daily Pivot Point S3 | 146.34 |
| Daily Pivot Point R1 | 147.80 |
| Daily Pivot Point R2 | 148.13 |
| Daily Pivot Point R3 | 148.52 |
[/s2If]
Download Nehcap EAWe have two EAs that are operational on our LIVE accounts.
- EA-FIX: Check out the details here. Download EA-FIX . EA-FIX is a non-grid HFT scalper.
- EA-GROWTH: High quality low dd EA using trend grids. Download EA_GROWTHJoin Our Telegram Group


