The currency pair USDCHF, currently trading at 0.89314, saw an increase in value. However, it is still facing downward pressure as US economic data is anticipated.
…
This is a premium post.
[s2If !current_user_can(access_s2member_level4)]Please register for FREE REGISTER to read full post below containing analysis. In case of any error or you think you are not able to read the full post below, please email us at support#nehcap.com [lwa][/s2If] [s2If current_user_can(access_s2member_level1)]
- USD/CHF experienced gains but is still remaining under pressure ahead of US economic data.
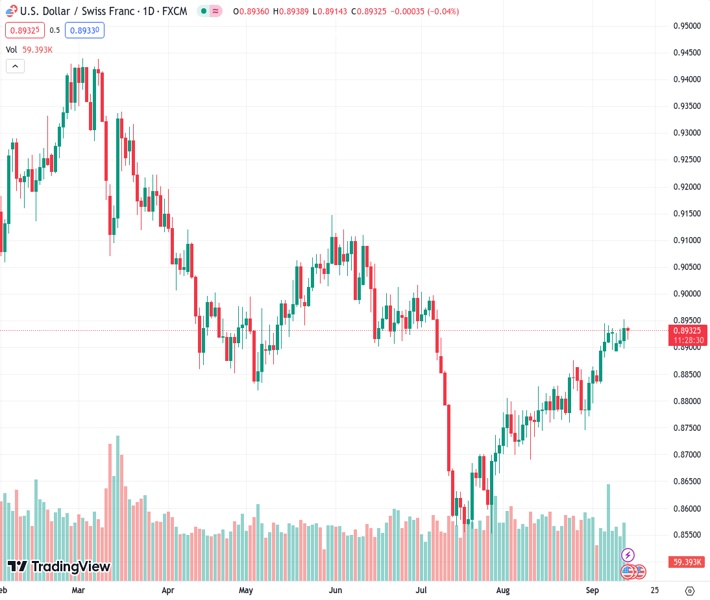
The pair currently trades last at 0.89314.
The previous day high was 0.8952 while the previous day low was 0.8907. The daily 38.2% Fib levels comes at 0.8935, expected to provide resistance. Similarly, the daily 61.8% fib level is at 0.8924, expected to provide support.
USD/CHF has almost recovered from the intraday losses, trading around 0.8930 during the European session on Thursday. However, the pair remains under pressure ahead of more economic data releases from the United States (US) scheduled to be released later in the North American session.
US Commerce Secretary Gina Raimondo is scheduled to meet on Tuesday with the CEOs of major American corporations, following her recent visit to China. This renewed tension in the US-China trade relationship could potentially influence the trader to buy safe-haven assets like the Swiss Franc (CHF).
Federal Statistical Office of Switzerland released Producer and Import Prices (Aug) on Thursday. The Swiss inflation indicator showed a decline of 0.2% on the monthly rate, against the expected hike of 0.1% and the previous reading of 0.1% decline. While the yearly rate showed a decline of 0.8% against the previous fall of 0.6%.
Moreover, the USD/CHF pair registered gains on the previous day, which could be attributed to the US upbeat Consumer Price Index (CPI) data.
US inflation figures rose to 3.7% on the annual rate from the previous rate of 3.2%, exceeding the market’s anticipated rate of 3.6% for August. Additionally, the monthly core Consumer Price Index (CPI) improved to 0.3% from the 0.2% prior, contrasting with the market expectations of remaining unchanged.
However, the annual core inflation rate held steady at the expected rate of 4.3%, marking a decrease from the previous 4.7%. The inflation report suggests that while overall inflation might be moderating, the Core Consumer Price Index (CPI) remains relatively unchanged.
Investors appear to be pricing in the likelihood of the US Federal Reserve (Fed) maintaining a dovish stance in its September meeting, which may exert pressure in undermining the US Dollar (USD).
CME FedWatch Tool suggests a 40% chance of the US Federal Reserve (Fed) implementing a 25 basis points (bps) rate hike in November. Investors are becoming more cautious regarding the potential for such a move as they evaluate the changing economic overview and Fed communications.
US Dollar Index (DXY) is paring back some of its earlier losses and trading around 104.70. This rebound in DXY is being supported by a recovery in US Treasury yields, with the yield on the 10-year US bond rising to 4.26% by the press time.
Market participants will likely watch the release of the Core Producer Price Index (PPI) and Retail Sales figures for August from the United States. These economic indicators have the potential to offer valuable insights into the state of economic activity in the nation, which could influence trading decisions and market sentiment.
Technical Levels: Supports and Resistances
USDCHF currently trading at 0.8931 at the time of writing. Pair opened at 0.8937 and is trading with a change of -0.07 % .
| Overview | Overview.1 | |
|---|---|---|
| 0 | Today last price | 0.8931 |
| 1 | Today Daily Change | -0.0006 |
| 2 | Today Daily Change % | -0.0700 |
| 3 | Today daily open | 0.8937 |
The pair is trading above its 20 Daily moving average @ 0.8852, above its 50 Daily moving average @ 0.8774 , above its 100 Daily moving average @ 0.888 and below its 200 Daily moving average @ 0.9046
| Trends | Trends.1 | |
|---|---|---|
| 0 | Daily SMA20 | 0.8852 |
| 1 | Daily SMA50 | 0.8774 |
| 2 | Daily SMA100 | 0.8880 |
| 3 | Daily SMA200 | 0.9046 |
The previous day high was 0.8952 while the previous day low was 0.8907. The daily 38.2% Fib levels comes at 0.8935, expected to provide resistance. Similarly, the daily 61.8% fib level is at 0.8924, expected to provide support.
Note the levels of interest below:
- Pivot support is noted at 0.8912, 0.8887, 0.8867
- Pivot resistance is noted at 0.8957, 0.8977, 0.9002
| Levels | Levels.1 |
|---|---|
| Previous Daily High | 0.8952 |
| Previous Daily Low | 0.8907 |
| Previous Weekly High | 0.8945 |
| Previous Weekly Low | 0.8833 |
| Previous Monthly High | 0.8876 |
| Previous Monthly Low | 0.8690 |
| Daily Fibonacci 38.2% | 0.8935 |
| Daily Fibonacci 61.8% | 0.8924 |
| Daily Pivot Point S1 | 0.8912 |
| Daily Pivot Point S2 | 0.8887 |
| Daily Pivot Point S3 | 0.8867 |
| Daily Pivot Point R1 | 0.8957 |
| Daily Pivot Point R2 | 0.8977 |
| Daily Pivot Point R3 | 0.9002 |
[/s2If]
Download Nehcap EAWe have two EAs that are operational on our LIVE accounts.
- EA-FIX: Check out the details here. Download EA-FIX . EA-FIX is a non-grid HFT scalper.
- EA-GROWTH: High quality low dd EA using trend grids. Download EA_GROWTHJoin Our Telegram Group


