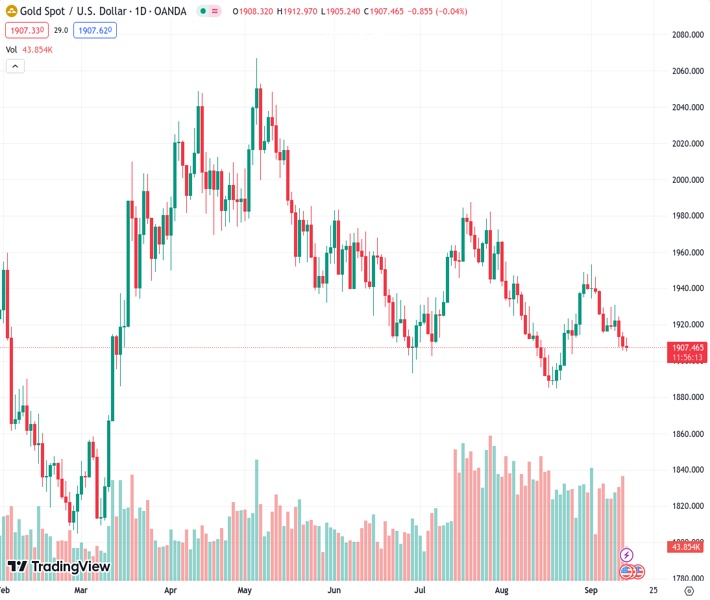
The current price of gold, denoted as XAUUSD and valued at $1,907.09, maintains its position above the $1,900 mark. However, it continues to face downward pressure due to anticipation surrounding upcoming economic data from the United States.
…
This is a premium post.
[s2If !current_user_can(access_s2member_level4)]Please register for FREE REGISTER to read full post below containing analysis. In case of any error or you think you are not able to read the full post below, please email us at support#nehcap.com [lwa][/s2If] [s2If current_user_can(access_s2member_level1)]
- Gold price holds ground above $1,900, remaining under pressure ahead of US economic data.
The pair currently trades last at 1907.09.
The previous day high was 1915.79 while the previous day low was 1905.59. The daily 38.2% Fib levels comes at 1909.49, expected to provide resistance. Similarly, the daily 61.8% fib level is at 1911.89, expected to provide resistance.
Gold price attempted to recover from the recent losses in the Asian session but later extended the losing streak, trading slightly lower near $1,900 per troy ounce during the European session on Thursday. The yellow metal hovers near three-week lows, remaining under pressure possibly due to upbeat Consumer Price Index (CPI) data from the United States (US).
US inflation figure for the year-over-year period rose to 3.7% from the previous rate of 3.2%, surpassing the market’s anticipated rate of 3.6% for August. Additionally, the monthly core CPI increased to 0.3% from the previous 0.2% for the same month. This uptick was unexpected, as market expectations had been for it to remain unchanged.
The annual core inflation rate remained stable at 4.3% as expected, which was a decline from the previous figure of 4.7%. The inflation report indicates that overall inflation may be moderating, but the Core Consumer Price Index (CPI) remains relatively stable.
US Dollar Index (DXY) is trimming the losses it made earlier in the session, trading around 104.70 at the time of writing. DXY is experiencing upward support on the back of the improved US Treasury yields. The yield on a 10-year US bond improved to 4.25 by the press time.
Investors seem to accept the odds that the US Federal Reserve (Fed) may maintain a dovish stance in its September meeting. The market caution could exert pressure on the US Dollar (USD).
CME FedWatch Tool indicates a 40% likelihood of a 25 basis points (bps) rate increase by the Fed in November. Investors turn cautious about the possibility of such a move as they assess the evolving economic overview and Fed statements.
Market participants await the data releases of the Core Producer Price Index (PPI) and Retail Sales figures for August from the US. These economic indicators could provide valuable insights into the state of economic activities in the nation.
These data outcomes could influence trading decisions and market sentiment, particularly concerning non-yield assets like Gold.
Technical Levels: Supports and Resistances
XAUUSD currently trading at 1905.99 at the time of writing. Pair opened at 1908.12 and is trading with a change of -0.11 % .
| Overview | Overview.1 | |
|---|---|---|
| 0 | Today last price | 1905.99 |
| 1 | Today Daily Change | -2.13 |
| 2 | Today Daily Change % | -0.11 |
| 3 | Today daily open | 1908.12 |
The pair remains strongly bearish on the daily time frame. It trades below the 20 SMA @ 1918.15, 50 SMA 1931.85, 100 SMA @ 1948.34 and 200 SMA @ 1920.92.
| Trends | Trends.1 | |
|---|---|---|
| 0 | Daily SMA20 | 1918.15 |
| 1 | Daily SMA50 | 1931.85 |
| 2 | Daily SMA100 | 1948.34 |
| 3 | Daily SMA200 | 1920.92 |
The previous day high was 1915.79 while the previous day low was 1905.59. The daily 38.2% Fib levels comes at 1909.49, expected to provide resistance. Similarly, the daily 61.8% fib level is at 1911.89, expected to provide resistance.
Note the levels of interest below:
- Pivot support is noted at 1903.88, 1899.63, 1893.68
- Pivot resistance is noted at 1914.08, 1920.03, 1924.28
| Levels | Levels.1 |
|---|---|
| Previous Daily High | 1915.79 |
| Previous Daily Low | 1905.59 |
| Previous Weekly High | 1946.35 |
| Previous Weekly Low | 1915.33 |
| Previous Monthly High | 1966.08 |
| Previous Monthly Low | 1884.85 |
| Daily Fibonacci 38.2% | 1909.49 |
| Daily Fibonacci 61.8% | 1911.89 |
| Daily Pivot Point S1 | 1903.88 |
| Daily Pivot Point S2 | 1899.63 |
| Daily Pivot Point S3 | 1893.68 |
| Daily Pivot Point R1 | 1914.08 |
| Daily Pivot Point R2 | 1920.03 |
| Daily Pivot Point R3 | 1924.28 |
[/s2If]
Download Nehcap EAWe have two EAs that are operational on our LIVE accounts.
- EA-FIX: Check out the details here. Download EA-FIX . EA-FIX is a non-grid HFT scalper.
- EA-GROWTH: High quality low dd EA using trend grids. Download EA_GROWTHJoin Our Telegram Group


