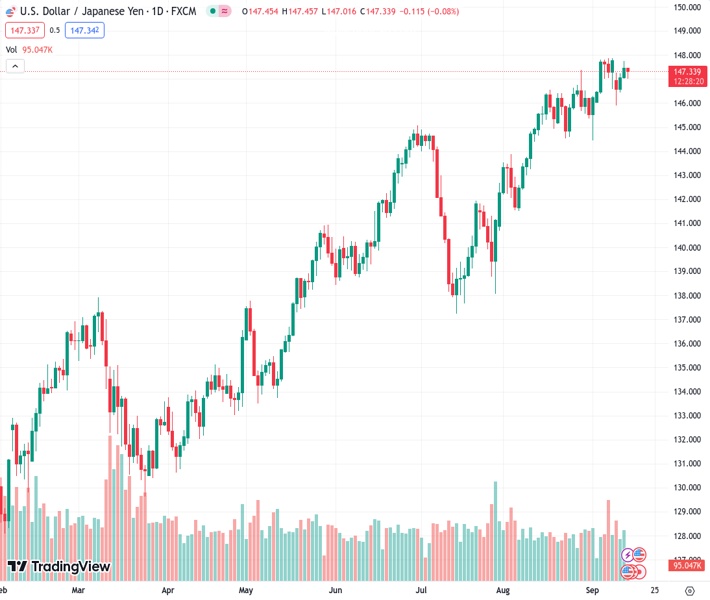
On Thursday, the USDJPY exchange rate at 147.330 experiences a decrease in demand and faces challenges due to multiple influences.
…
This is a premium post.
[s2If !current_user_can(access_s2member_level4)]Please register for FREE REGISTER to read full post below containing analysis. In case of any error or you think you are not able to read the full post below, please email us at support#nehcap.com [lwa][/s2If] [s2If current_user_can(access_s2member_level1)]
- USD/JPY meets with some supply on Thursday and is pressured by a combination of factors.
The pair currently trades last at 147.330.
The previous day high was 147.74 while the previous day low was 147.02. The daily 38.2% Fib levels comes at 147.47, expected to provide resistance. Similarly, the daily 61.8% fib level is at 147.29, expected to provide support.
The USD/JPY pair comes under some selling pressure on Thursday and reverses the previous day’s positive move to the 147.75 area, or the weekly high. Spot prices, however, manage to recover a few pips from the daily low and trade around the 147.25 region, down less than 0.15% during the early part of the European session.
Speculations that the Bank of Japan (BoJ) will end its ultra-easy monetary policy underpin the Japanese Yen (JPY). This, along with a modest US Dollar (USD) downtick, fail to assist the USD/JPY pair to capitalize on its gains registered over the past two days. Spot prices, however, show some resilience below the 200-hour Simple Moving Average (SMA) and attract some buyers near the 147.00 round-figure mark, which should now act as a pivotal point for intraday traders.
Technical indicators on the daily chart, meanwhile, are holding in the bullish territory and have again started moving in the positive territory on the 1-hour chart. This, in turn, supports prospects for a further appreciating move for the USD/JPY pair. Hence, a subsequent move back towards testing 147.85 region, or the highest level since November 2022, remains a distinct possibility. This is followed by the 148.00 mark, which if cleared will be seen as a fresh trigger for bulls.
The USD/JPY pair might then accelerate the momentum towards the 148.70-148.80 hurdle before aiming to conquer the 148.00 mark for the first time since October 2022. That said, speculations that Japanese authorities might interfere in the FX market to prop up the domestic currency might hold back bulls from placing fresh bets and cap any further upside for spot prices.
On the flip side, the 147.00 round figure might continue to protect the immediate downside ahead of the 146.75-146.70 region, representing an ascending trend-line support extending from the late July swing low. A convincing break below might prompt aggressive technical selling and drag the USD/JPY pair towards the 146.00 mark. The corrective decline could get extended to the 145.30 area en route to the 145.00 psychological mark and the monthly low, around the 144.45 zone.
Technical Levels: Supports and Resistances
USDJPY currently trading at 147.29 at the time of writing. Pair opened at 147.46 and is trading with a change of -0.12 % .
| Overview | Overview.1 | |
|---|---|---|
| 0 | Today last price | 147.29 |
| 1 | Today Daily Change | -0.17 |
| 2 | Today Daily Change % | -0.12 |
| 3 | Today daily open | 147.46 |
The pair remains strongly bullish on the daily timeframe. It trades above its 20 SMA @ 146.45, 50 SMA 143.69, 100 SMA @ 141.57 and 200 SMA @ 137.24.
| Trends | Trends.1 | |
|---|---|---|
| 0 | Daily SMA20 | 146.45 |
| 1 | Daily SMA50 | 143.69 |
| 2 | Daily SMA100 | 141.57 |
| 3 | Daily SMA200 | 137.24 |
The previous day high was 147.74 while the previous day low was 147.02. The daily 38.2% Fib levels comes at 147.47, expected to provide resistance. Similarly, the daily 61.8% fib level is at 147.29, expected to provide support.
Note the levels of interest below:
- Pivot support is noted at 147.07, 146.68, 146.34
- Pivot resistance is noted at 147.8, 148.13, 148.52
| Levels | Levels.1 |
|---|---|
| Previous Daily High | 147.74 |
| Previous Daily Low | 147.02 |
| Previous Weekly High | 147.88 |
| Previous Weekly Low | 146.02 |
| Previous Monthly High | 147.38 |
| Previous Monthly Low | 141.51 |
| Daily Fibonacci 38.2% | 147.47 |
| Daily Fibonacci 61.8% | 147.29 |
| Daily Pivot Point S1 | 147.07 |
| Daily Pivot Point S2 | 146.68 |
| Daily Pivot Point S3 | 146.34 |
| Daily Pivot Point R1 | 147.80 |
| Daily Pivot Point R2 | 148.13 |
| Daily Pivot Point R3 | 148.52 |
[/s2If]
Download Nehcap EAWe have two EAs that are operational on our LIVE accounts.
- EA-FIX: Check out the details here. Download EA-FIX . EA-FIX is a non-grid HFT scalper.
- EA-GROWTH: High quality low dd EA using trend grids. Download EA_GROWTHJoin Our Telegram Group


