The USDCAD continues to decline despite the positive US CPI figures.
…
This is a premium post.
[s2If !current_user_can(access_s2member_level4)]Please register for FREE REGISTER to read full post below containing analysis. In case of any error or you think you are not able to read the full post below, please email us at support#nehcap.com [lwa][/s2If] [s2If current_user_can(access_s2member_level1)]
- USD/CAD extends its losses despite the upbeat US CPI data.
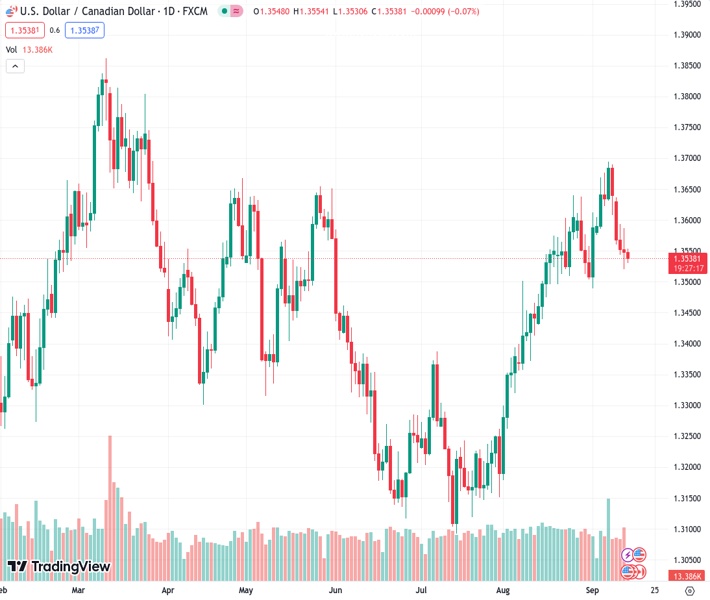
The pair currently trades last at 1.35333.
The previous day high was 1.3587 while the previous day low was 1.3521. The daily 38.2% Fib levels comes at 1.3546, expected to provide resistance. Similarly, the daily 61.8% fib level is at 1.3562, expected to provide resistance.
USD/CAD extends its losing streak on the fifth day, trading with a negative bias around 1.3530 during the early trading hours of the Asian session on Thursday. The pair experienced downward pressure potentially due to higher Crude oil prices.
However, the better-than-expected Consumer Price Index (CPI) data from the United States (US) provided support to limit the losses of the USD/CAD pair. US CPI (YoY) rose to 3.7% from the previous rate of 3.2%, surpassing the market consensus of 3.6% in August.
The monthly core CPI improved to 0.3% from 0.2% prior, which was expected to remain unchanged. However, the annual core rate printed the reading of 4.3% as expected from the previous 4.7% figure.
Western Texas Intermediate (WTI), Crude oil price continues the winning streak, hovering around $88.30 per barrel at the time of writing. The black gold has held a position near highs since November and continues to receive strong support due to concerns about tightening global supplies.
The tightening supply conditions are further exacerbated by the additional reductions recently declared by Saudi Arabia and Russia, the two largest oil producers globally. These cuts, scheduled for the remainder of 2023, continue to support Oil prices and strengthen the Canadian Dollar (CAD).
US Dollar Index (DXY), which measures the performance of the US Dollar (USD) against a basket of the other major six currencies, attempts to retreat from the previous day’s gains. The spot price trades lower around 104.70.
The index experienced upward support on Wednesday due to the initial jump in US Treasury yields but later retreated, with the 10-year US bond yields settling at 4.23% by the press time.
Market participants have shifted their attention to the upcoming data releases from the US, including Core Producer Price Index (PPI) and Retail Sales for August. These datasets will provide further cues on economic activities in the US, which could help the traders strategize their bets on the USD/CAD pair.
Technical Levels: Supports and Resistances
USDCAD currently trading at 1.3533 at the time of writing. Pair opened at 1.3549 and is trading with a change of -0.12 % .
| Overview | Overview.1 | |
|---|---|---|
| 0 | Today last price | 1.3533 |
| 1 | Today Daily Change | -0.0016 |
| 2 | Today Daily Change % | -0.1200 |
| 3 | Today daily open | 1.3549 |
The pair is trading below its 20 Daily moving average @ 1.3578, above its 50 Daily moving average @ 1.3406 , above its 100 Daily moving average @ 1.3404 and above its 200 Daily moving average @ 1.3466
| Trends | Trends.1 | |
|---|---|---|
| 0 | Daily SMA20 | 1.3578 |
| 1 | Daily SMA50 | 1.3406 |
| 2 | Daily SMA100 | 1.3404 |
| 3 | Daily SMA200 | 1.3466 |
The previous day high was 1.3587 while the previous day low was 1.3521. The daily 38.2% Fib levels comes at 1.3546, expected to provide resistance. Similarly, the daily 61.8% fib level is at 1.3562, expected to provide resistance.
Note the levels of interest below:
- Pivot support is noted at 1.3518, 1.3486, 1.3451
- Pivot resistance is noted at 1.3584, 1.3619, 1.365
| Levels | Levels.1 |
|---|---|
| Previous Daily High | 1.3587 |
| Previous Daily Low | 1.3521 |
| Previous Weekly High | 1.3694 |
| Previous Weekly Low | 1.3576 |
| Previous Monthly High | 1.3640 |
| Previous Monthly Low | 1.3184 |
| Daily Fibonacci 38.2% | 1.3546 |
| Daily Fibonacci 61.8% | 1.3562 |
| Daily Pivot Point S1 | 1.3518 |
| Daily Pivot Point S2 | 1.3486 |
| Daily Pivot Point S3 | 1.3451 |
| Daily Pivot Point R1 | 1.3584 |
| Daily Pivot Point R2 | 1.3619 |
| Daily Pivot Point R3 | 1.3650 |
[/s2If]
Download Nehcap EAWe have two EAs that are operational on our LIVE accounts.
- EA-FIX: Check out the details here. Download EA-FIX . EA-FIX is a non-grid HFT scalper.
- EA-GROWTH: High quality low dd EA using trend grids. Download EA_GROWTHJoin Our Telegram Group


