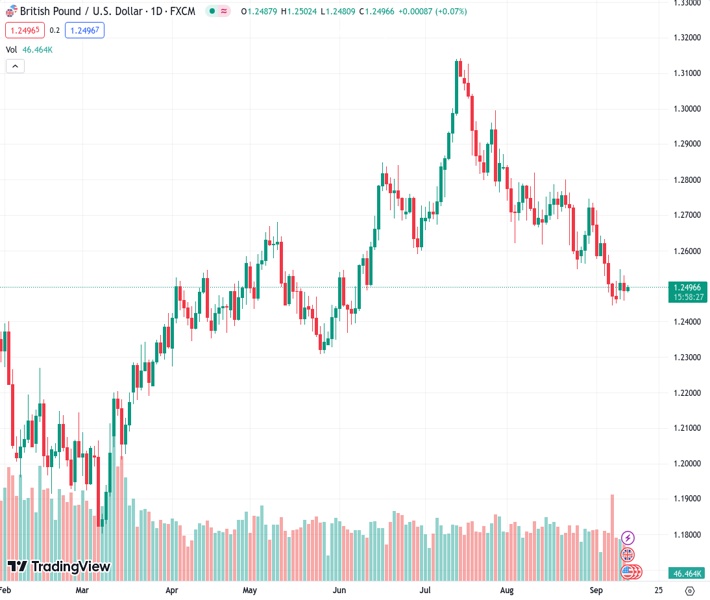
The currency pair GBPUSD is fluctuating between the levels of 1.2480 and 1.2502 within a defined range.
…
This is a premium post.
[s2If !current_user_can(access_s2member_level4)]Please register for FREE REGISTER to read full post below containing analysis. In case of any error or you think you are not able to read the full post below, please email us at support#nehcap.com [lwa][/s2If] [s2If current_user_can(access_s2member_level1)]
- GBP/USD oscillates in the 1.2480-1.2502 region in a trading band.
The pair currently trades last at 1.24951.
The previous day high was 1.2531 while the previous day low was 1.2459. The daily 38.2% Fib levels comes at 1.2487, expected to provide support. Similarly, the daily 61.8% fib level is at 1.2504, expected to provide resistance.
The GBP/USD pair consolidates in a familiar range below the 1.2500 barrier during the Asian session on Wednesday. The major pair currently trades near 1.2488, losing 0.01% on the day. Market players prefer to wait on the sidelines ahead of the UK Gross Domestic Product (GDP) data for July and the highly anticipated US Consumer Price Index (CPI) data. These figures could trigger the volatility in the pair.
The Bank of England (BoE) policymaker Catherine Mann remarked on Monday that it was too early for the central bank to pause interest rates and that it was better for the central bank to err on the side of rising rates too high rather than suspending them too soon. The hawkish comments by BoE governors may restrict the British Pound’s fall and serve as a tailwind for GBP/USD.
About the data, the UK’s Office for National Statistics reported on Tuesday that the UK Unemployment Rate in the three months to July came in at 4.3% from 4.2% in the previous reading, in line with the market consensus.
From the technical perspective, GBP/USD holds below the 50- and 100-hour Exponential Moving Averages (EMAs) on the one-hour chart, which means further downside looks favorable. Meanwhile, the Relative Strength Index (RSI) stands below 50, within bearish territory, suggesting that sellers are likely to retain control in the near term.
The critical resistance level for GBP/USD emerges at the 1.2500-1.2505 region, presenting a confluence of the upper boundary of the Bollinger Band, a psychological round figure, and the 100-hour EMA. The additional upside filter is located at 1.2530 (a high of September 12). Further north, 1.2548 will be the next barrier for the pair, followed by a psychological mark at 1.2600.
On the downside, any follow-through selling below the lower limit of the Bollinger Band and a low of September 12 at 1.2460 will challenge the next contention at 1.2440 (a low of May 12) en route to 1.2390 (a low of June 6) and finally at 1.2350 (a low of May 31).
Technical Levels: Supports and Resistances
GBPUSD currently trading at 1.2489 at the time of writing. Pair opened at 1.249 and is trading with a change of -0.01 % .
| Overview | Overview.1 | |
|---|---|---|
| 0 | Today last price | 1.2489 |
| 1 | Today Daily Change | -0.0001 |
| 2 | Today Daily Change % | -0.0100 |
| 3 | Today daily open | 1.2490 |
The pair is trading below its 20 Daily moving average @ 1.2624, below its 50 Daily moving average @ 1.2753 , below its 100 Daily moving average @ 1.2656 and above its 200 Daily moving average @ 1.243
| Trends | Trends.1 | |
|---|---|---|
| 0 | Daily SMA20 | 1.2624 |
| 1 | Daily SMA50 | 1.2753 |
| 2 | Daily SMA100 | 1.2656 |
| 3 | Daily SMA200 | 1.2430 |
The previous day high was 1.2531 while the previous day low was 1.2459. The daily 38.2% Fib levels comes at 1.2487, expected to provide support. Similarly, the daily 61.8% fib level is at 1.2504, expected to provide resistance.
Note the levels of interest below:
- Pivot support is noted at 1.2456, 1.2422, 1.2385
- Pivot resistance is noted at 1.2527, 1.2565, 1.2599
| Levels | Levels.1 |
|---|---|
| Previous Daily High | 1.2531 |
| Previous Daily Low | 1.2459 |
| Previous Weekly High | 1.2643 |
| Previous Weekly Low | 1.2446 |
| Previous Monthly High | 1.2841 |
| Previous Monthly Low | 1.2548 |
| Daily Fibonacci 38.2% | 1.2487 |
| Daily Fibonacci 61.8% | 1.2504 |
| Daily Pivot Point S1 | 1.2456 |
| Daily Pivot Point S2 | 1.2422 |
| Daily Pivot Point S3 | 1.2385 |
| Daily Pivot Point R1 | 1.2527 |
| Daily Pivot Point R2 | 1.2565 |
| Daily Pivot Point R3 | 1.2599 |
[/s2If]
Download Nehcap EAWe have two EAs that are operational on our LIVE accounts.
- EA-FIX: Check out the details here. Download EA-FIX . EA-FIX is a non-grid HFT scalper.
- EA-GROWTH: High quality low dd EA using trend grids. Download EA_GROWTHJoin Our Telegram Group


