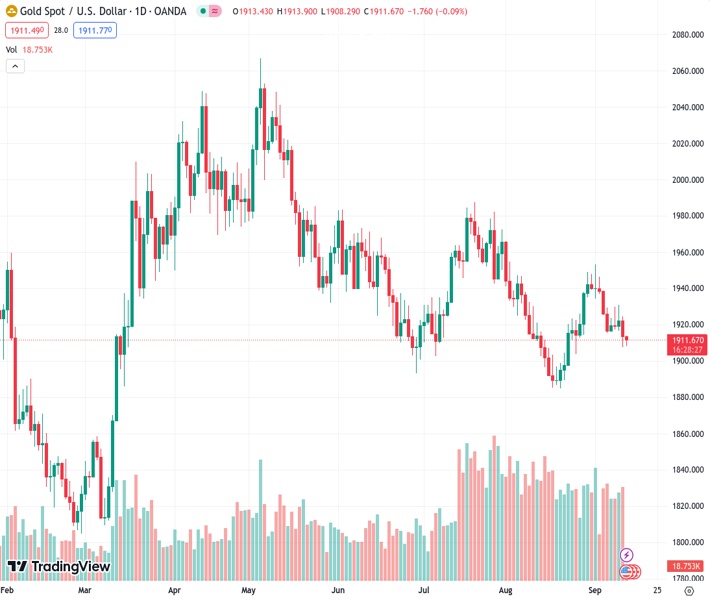
The price of gold, indicated by #XAUUSD at $1,911.72, has trended downwards for the second consecutive day and is encountering difficulty in staying above the lowest point of the month.
…
This is a premium post.
[s2If !current_user_can(access_s2member_level4)]Please register for FREE REGISTER to read full post below containing analysis. In case of any error or you think you are not able to read the full post below, please email us at support#nehcap.com [lwa][/s2If] [s2If current_user_can(access_s2member_level1)]
- Gold price drifts lower for the second straight day and struggles near the monthly low.
The pair currently trades last at 1911.72.
The previous day high was 1924.6 while the previous day low was 1907.64. The daily 38.2% Fib levels comes at 1914.12, expected to provide resistance. Similarly, the daily 61.8% fib level is at 1918.12, expected to provide resistance.
Gold price remains under some selling pressure for the second successive day on Wednesday and languishes near the monthly low touched the previous day. The XAU/USD trades around the $1,910 level during the Asian session and seems poised to prolong the recent downfall from the $1,953 region, or a one-month peak, around set on September 1.
The US Dollar (USD) attracts fresh buying following Tuesday’s good two-way price swings and is seen as a key factor undermining demand for the Gold price. Expectations that the Federal Reserve (Fed) will stick to its hawkish stance remain supportive of elevated US Treasury bond yields and continue to act as a tailwind for the Greenback. Market participants seem convinced that the Fed will keep interest rates higher for longer and have been pricing in the possibility of one more 25 basis points (bps) lift-off by the end of this year.
The bets were reaffirmed by the upbeat US macro data released last week, which pointed to a resilient economy. Furthermore, the fact, that inflation is not cooling fast enough supports prospects for further policy tightening by the Fed. Hence, the market focus remains glued to the US consumer inflation figures, due later during the early North American session. The crucial US Consumer Price Index (CPI) will influence expectations about the Fed’s future rate-hike path and provide a fresh directional impetus to the non-yielding Gold price.
Any signs of sticky inflation might set the stage for the resumption of the USD’s recent rally to a six-month peak and pave the way for a further depreciating move for the Gold price. That said, a generally softer risk tone might hold back bears from placing fresh bets around the safe-haven XAU/USD. The market sentiment remains fragile in the wake of concerns about the worsening economic conditions in China. Adding to this, worries about headwinds stemming from rapidly rising borrowing costs temper investors’ appetite for riskier assets.
Nevertheless, the aforementioned fundamental backdrop seems tilted firmly in favour of bearish traders and suggests that the path of least resistance for the Gold price is to the downside. Moreover, the overnight breakdown and close below a technically significant 200-day Simple Moving Average (SMA) validate the negative outlook for the XAU/USD. Hence, any positive reaction to the US macro data might still be seen as a selling opportunity and run the risk of fizzling out rather quickly.
Technical Levels: Supports and Resistances
XAUUSD currently trading at 1910.4 at the time of writing. Pair opened at 1913.52 and is trading with a change of -0.16 % .
| Overview | Overview.1 | |
|---|---|---|
| 0 | Today last price | 1910.40 |
| 1 | Today Daily Change | -3.12 |
| 2 | Today Daily Change % | -0.16 |
| 3 | Today daily open | 1913.52 |
The pair remains strongly bearish on the daily time frame. It trades below the 20 SMA @ 1917.33, 50 SMA 1932.0, 100 SMA @ 1949.15 and 200 SMA @ 1920.24.
| Trends | Trends.1 | |
|---|---|---|
| 0 | Daily SMA20 | 1917.33 |
| 1 | Daily SMA50 | 1932.00 |
| 2 | Daily SMA100 | 1949.15 |
| 3 | Daily SMA200 | 1920.24 |
The previous day high was 1924.6 while the previous day low was 1907.64. The daily 38.2% Fib levels comes at 1914.12, expected to provide resistance. Similarly, the daily 61.8% fib level is at 1918.12, expected to provide resistance.
Note the levels of interest below:
- Pivot support is noted at 1905.91, 1898.29, 1888.95
- Pivot resistance is noted at 1922.87, 1932.21, 1939.83
| Levels | Levels.1 |
|---|---|
| Previous Daily High | 1924.60 |
| Previous Daily Low | 1907.64 |
| Previous Weekly High | 1946.35 |
| Previous Weekly Low | 1915.33 |
| Previous Monthly High | 1966.08 |
| Previous Monthly Low | 1884.85 |
| Daily Fibonacci 38.2% | 1914.12 |
| Daily Fibonacci 61.8% | 1918.12 |
| Daily Pivot Point S1 | 1905.91 |
| Daily Pivot Point S2 | 1898.29 |
| Daily Pivot Point S3 | 1888.95 |
| Daily Pivot Point R1 | 1922.87 |
| Daily Pivot Point R2 | 1932.21 |
| Daily Pivot Point R3 | 1939.83 |
[/s2If]
Download Nehcap EAWe have two EAs that are operational on our LIVE accounts.
- EA-FIX: Check out the details here. Download EA-FIX . EA-FIX is a non-grid HFT scalper.
- EA-GROWTH: High quality low dd EA using trend grids. Download EA_GROWTHJoin Our Telegram Group


