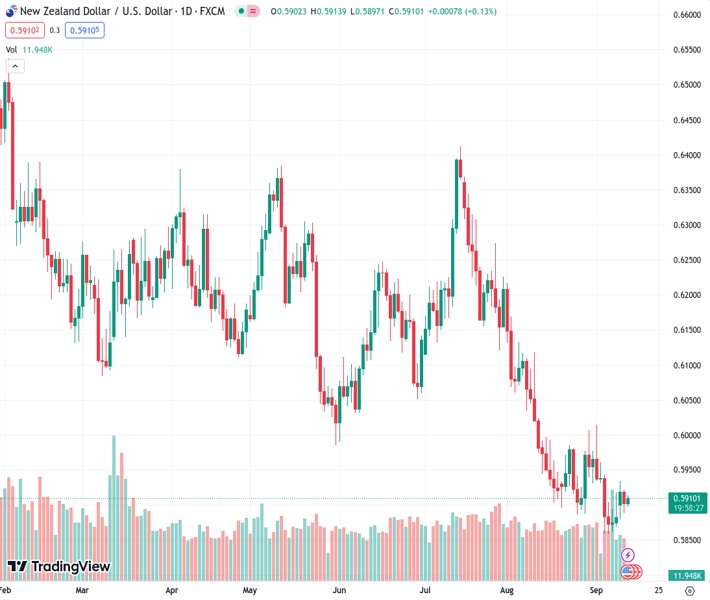
The NZDUSD currency pair remains above the 0.5900 level as the US dollar weakens.
…
This is a premium post.
[s2If !current_user_can(access_s2member_level4)]Please register for FREE REGISTER to read full post below containing analysis. In case of any error or you think you are not able to read the full post below, please email us at support#nehcap.com [lwa][/s2If] [s2If current_user_can(access_s2member_level1)]
- NZD/USD holds above the 0.5900 mark amid the weakening USD.
The pair currently trades last at 0.59081.
The previous day high was 0.5931 while the previous day low was 0.5889. The daily 38.2% Fib levels comes at 0.5905, expected to provide support. Similarly, the daily 61.8% fib level is at 0.5915, expected to provide resistance.
The NZD/USD pair gains traction above the 0.5900 during the early Asian session on Wednesday. A decline in the US Dollar (USD) lifts the New Zealand Dollar (NZD) ahead of the US Consumer Price Index (CPI). Meanwhile, the US Dollar Index (DXY), a measure of the value of the USD versus a basket of global currencies, hovers around 104.50 after retracing from a 104.90 high.
The latest data from Statistics New Zealand revealed on Wednesday that the Food Price Index (FPI) for August rose by 0.5% MoM from a 0.5% drop in the previous month. Earlier this week, the nation’s Electronic Card Retail Sales for August came in at 3.7% YoY from 2.2% in the previous reading, while the monthly figure grew 0.7% versus 0% prior. The Visitor Arrivals for July came in at 59.3% YoY from the previous reading of 88.5%. However, the Kiwi did not react to the figures, and the headline surrounding the US-China relationship and China’s economic condition will influence the Kiwi for the time being.
Furthermore, US Commerce Secretary Gina Raimondo is set to meet with the CEOs of key American corporations this week, two weeks after visiting China and raising worries about business conditions, per Reuters. The renewed trade war tension between the US and China might exert some selling pressure and act as a headwind for the China-proxy New Zealand Dollar (NZD).
On the US Dollar front, the Greenback may benefit from the higher for longer interest rate narrative in the US. According to the CME Fedwatch Tool, traders expect the Federal Reserve (Fed) to keep the interest rate unchanged in September at 5.25%-5.50%, with a 93% chance. However, the market has priced in a 56% chance that the Fed will hold its current monetary policy unchanged in its November meeting.
The US Consumer Price Index (CPI) for August will be in the spotlight on Wednesday. The annual figure is anticipated to rise from 3.2% to 3.6%, while the core figure is expected to fall from 4.7% to 4.3%. The data might trigger volatility in the FX market and influence an expectation on the Federal Reserve’s monetary policy.
Moving on, market players will closely watch the US Consumer Price Index (CPI) data on Wednesday. Later this week, the US Retail Sales and Producer Price Index (PPI) will be released on Thursday. Also, New Zealand’s Business NZ PMI for August will be due on Friday. These figures could give a clear direction to the NZD/USD pair.
Technical Levels: Supports and Resistances
NZDUSD currently trading at 0.5911 at the time of writing. Pair opened at 0.5904 and is trading with a change of 0.12 % .
| Overview | Overview.1 | |
|---|---|---|
| 0 | Today last price | 0.5911 |
| 1 | Today Daily Change | 0.0007 |
| 2 | Today Daily Change % | 0.1200 |
| 3 | Today daily open | 0.5904 |
The pair remains strongly bearish on the daily time frame. It trades below the 20 SMA @ 0.5925, 50 SMA 0.607, 100 SMA @ 0.6119 and 200 SMA @ 0.6207.
| Trends | Trends.1 | |
|---|---|---|
| 0 | Daily SMA20 | 0.5925 |
| 1 | Daily SMA50 | 0.6070 |
| 2 | Daily SMA100 | 0.6119 |
| 3 | Daily SMA200 | 0.6207 |
The previous day high was 0.5931 while the previous day low was 0.5889. The daily 38.2% Fib levels comes at 0.5905, expected to provide support. Similarly, the daily 61.8% fib level is at 0.5915, expected to provide resistance.
Note the levels of interest below:
- Pivot support is noted at 0.5885, 0.5866, 0.5843
- Pivot resistance is noted at 0.5927, 0.595, 0.5969
| Levels | Levels.1 |
|---|---|
| Previous Daily High | 0.5931 |
| Previous Daily Low | 0.5889 |
| Previous Weekly High | 0.5961 |
| Previous Weekly Low | 0.5847 |
| Previous Monthly High | 0.6219 |
| Previous Monthly Low | 0.5885 |
| Daily Fibonacci 38.2% | 0.5905 |
| Daily Fibonacci 61.8% | 0.5915 |
| Daily Pivot Point S1 | 0.5885 |
| Daily Pivot Point S2 | 0.5866 |
| Daily Pivot Point S3 | 0.5843 |
| Daily Pivot Point R1 | 0.5927 |
| Daily Pivot Point R2 | 0.5950 |
| Daily Pivot Point R3 | 0.5969 |
[/s2If]
Download Nehcap EAWe have two EAs that are operational on our LIVE accounts.
- EA-FIX: Check out the details here. Download EA-FIX . EA-FIX is a non-grid HFT scalper.
- EA-GROWTH: High quality low dd EA using trend grids. Download EA_GROWTHJoin Our Telegram Group


