Gold is experiencing a slight decline as the upcoming US inflation data approaches.
…
This is a premium post.
[s2If !current_user_can(access_s2member_level4)]Please register for FREE REGISTER to read full post below containing analysis. In case of any error or you think you are not able to read the full post below, please email us at support#nehcap.com [lwa][/s2If] [s2If current_user_can(access_s2member_level1)]
- Gold is seeing a soft retreat as US inflation data looms ahead.
The pair currently trades last at 1912.91.
The previous day high was 1930.77 while the previous day low was 1916.64. The daily 38.2% Fib levels comes at 1925.37, expected to provide resistance. Similarly, the daily 61.8% fib level is at 1922.04, expected to provide resistance.
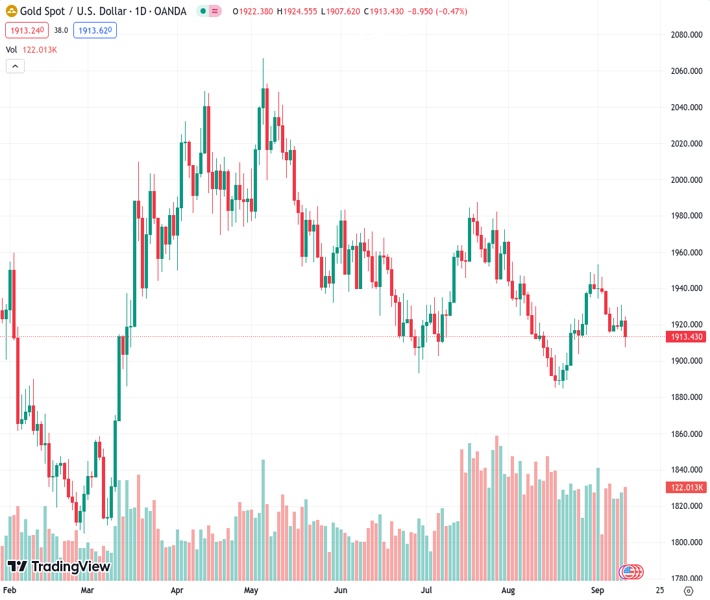
The XAU/USD is stepping lower in Tuesday trading, testing the $1,910.00 level as investors await US inflation figures on Wednesday’s Consumer Price Index (CPI) data release.
Metals investors will be taking a step back ahead of US inflation figures due tomorrow, and a firming up of the US Dollar (USD) index is taking the yellow metal down a peg, dropping below near-term bottoms and etching in a new low for the month of September.
If US CPI figures come in or above expectations, it could put further downside pressure on Gold. Headline CPI data for the month of August is forecast to come in at 0.6%, a step up from the previous month’s 0.2%. Core CPI (CPI excluding food and energy prices) for the same period is expected to hold steady at 0.2%.
Looking ahead to Thursday, US Retail Sales growth figures are expected to show a slight cooling off. August’s Retail Sales data is expected to print at 0.2%; still a positive number, but a reduced showing from the previous month’s 0.7% growth.
A disappointing showing for economic calendar data could see a firm round of support for the XAU/USD, but increasing economic activity will send the Greenback higher and push Gold another step down.
Gold is slightly lower in the early trading week, down from Monday’s opening prices near $1,920.00, and daily candlesticks are so far getting suppressed by a descending trendline from May’s high peak above $2,050.00. Adding to the resistance cloud gathering above Gold prices, the 100-day Simple Moving Average is descending to $1,950.00, and an inversion of the 50-day Exponential Moving Average sees the EMA building resistance into $1,930.00.
On the short side, support is coming from August’s swing low into $1,890.00, and despite consecutive lower lows on the daily chart, bearish momentum is waning as the fast and slow EMAs on the MACD indicator begin to consolidate.
Technical Levels: Supports and Resistances
XAUUSD currently trading at 1913.06 at the time of writing. Pair opened at 1922.42 and is trading with a change of -0.49 % .
| Overview | Overview.1 | |
|---|---|---|
| 0 | Today last price | 1913.06 |
| 1 | Today Daily Change | -9.36 |
| 2 | Today Daily Change % | -0.49 |
| 3 | Today daily open | 1922.42 |
The pair remains strongly bearish on the daily time frame. It trades below the 20 SMA @ 1916.74, 50 SMA 1932.22, 100 SMA @ 1949.99 and 200 SMA @ 1919.5.
| Trends | Trends.1 | |
|---|---|---|
| 0 | Daily SMA20 | 1916.74 |
| 1 | Daily SMA50 | 1932.22 |
| 2 | Daily SMA100 | 1949.99 |
| 3 | Daily SMA200 | 1919.50 |
The previous day high was 1930.77 while the previous day low was 1916.64. The daily 38.2% Fib levels comes at 1925.37, expected to provide resistance. Similarly, the daily 61.8% fib level is at 1922.04, expected to provide resistance.
Note the levels of interest below:
- Pivot support is noted at 1915.78, 1909.15, 1901.65
- Pivot resistance is noted at 1929.91, 1937.41, 1944.04
| Levels | Levels.1 |
|---|---|
| Previous Daily High | 1930.77 |
| Previous Daily Low | 1916.64 |
| Previous Weekly High | 1946.35 |
| Previous Weekly Low | 1915.33 |
| Previous Monthly High | 1966.08 |
| Previous Monthly Low | 1884.85 |
| Daily Fibonacci 38.2% | 1925.37 |
| Daily Fibonacci 61.8% | 1922.04 |
| Daily Pivot Point S1 | 1915.78 |
| Daily Pivot Point S2 | 1909.15 |
| Daily Pivot Point S3 | 1901.65 |
| Daily Pivot Point R1 | 1929.91 |
| Daily Pivot Point R2 | 1937.41 |
| Daily Pivot Point R3 | 1944.04 |
[/s2If]
Download Nehcap EAWe have two EAs that are operational on our LIVE accounts.
- EA-FIX: Check out the details here. Download EA-FIX . EA-FIX is a non-grid HFT scalper.
- EA-GROWTH: High quality low dd EA using trend grids. Download EA_GROWTHJoin Our Telegram Group


