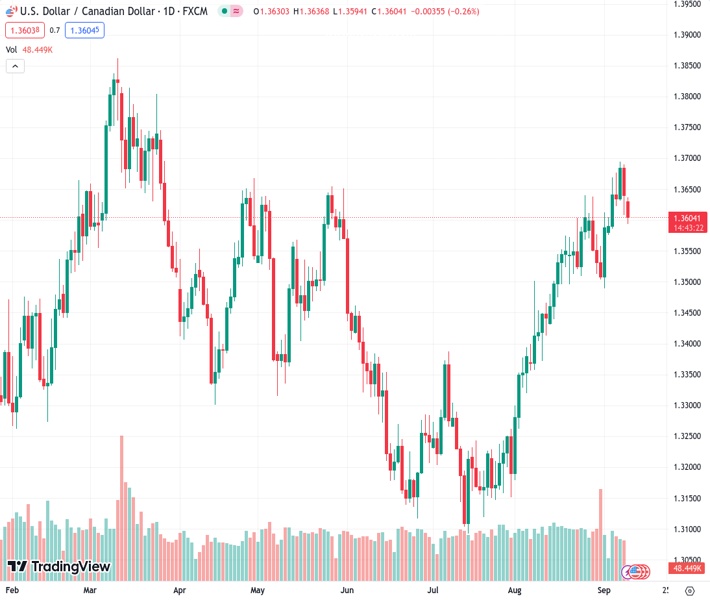
The USD/CAD pair is currently trading around the 1.3600 level, slightly higher than the important 100-hour EMA (Exponential Moving Average).
…
This is a premium post.
[s2If !current_user_can(access_s2member_level4)]Please register for FREE REGISTER to read full post below containing analysis. In case of any error or you think you are not able to read the full post below, please email us at support#nehcap.com [lwa][/s2If] [s2If current_user_can(access_s2member_level1)]
- USD/CAD is trading near the 1.3600 mark, above the key 100-hour EMA.
The pair currently trades last at 1.36020.
The previous day high was 1.369 while the previous day low was 1.3608. The daily 38.2% Fib levels comes at 1.3639, expected to provide resistance. Similarly, the daily 61.8% fib level is at 1.3659, expected to provide resistance.
The USD/CAD pair loses traction and hovers around the 1.3600 mark during the early European session on Monday. The weakening of the US Dollar (USD) and the upbeat Canadian employment data dragged the USD/CAD pair lower. The major pair currently trades near 1.3604, losing 0.25% on the day.
According to the four-hour chart, USD/CAD holds above the key 100-hour Exponential Moving Average (EMA), which supports the buyers for the time being. However, the Relative Strength Index (RSI) stands below 50, activating the bearish momentum for the USD/CAD pair for the time being.
Any follow-through buying above the middle line of the Bollinger Band and a high of May 31 at 1.3650 will pave the way to 1.3670 (a high of September 5). The additional upside filter to watch is 1.3692, representing the upper boundary of the Bollinger Band.
On the flip side, a decisive break below the 1.3600 will see a drop to 1.3575 (100-hour EMA). Further south, the next downside stop is seen at 1.3550 (a low of August 30). The next contention level is located at the 1.3495-1.3500 region, indicating a psychological round mark and a low of September 1.
Technical Levels: Supports and Resistances
USDCAD currently trading at 1.3603 at the time of writing. Pair opened at 1.3639 and is trading with a change of -0.26 % .
| Overview | Overview.1 | |
|---|---|---|
| 0 | Today last price | 1.3603 |
| 1 | Today Daily Change | -0.0036 |
| 2 | Today Daily Change % | -0.2600 |
| 3 | Today daily open | 1.3639 |
The pair remains strongly bullish on the daily timeframe. It trades above its 20 SMA @ 1.3569, 50 SMA 1.3388, 100 SMA @ 1.3405 and 200 SMA @ 1.3467.
| Trends | Trends.1 | |
|---|---|---|
| 0 | Daily SMA20 | 1.3569 |
| 1 | Daily SMA50 | 1.3388 |
| 2 | Daily SMA100 | 1.3405 |
| 3 | Daily SMA200 | 1.3467 |
The previous day high was 1.369 while the previous day low was 1.3608. The daily 38.2% Fib levels comes at 1.3639, expected to provide resistance. Similarly, the daily 61.8% fib level is at 1.3659, expected to provide resistance.
Note the levels of interest below:
- Pivot support is noted at 1.3601, 1.3564, 1.352
- Pivot resistance is noted at 1.3683, 1.3727, 1.3765
| Levels | Levels.1 |
|---|---|
| Previous Daily High | 1.3690 |
| Previous Daily Low | 1.3608 |
| Previous Weekly High | 1.3694 |
| Previous Weekly Low | 1.3576 |
| Previous Monthly High | 1.3640 |
| Previous Monthly Low | 1.3184 |
| Daily Fibonacci 38.2% | 1.3639 |
| Daily Fibonacci 61.8% | 1.3659 |
| Daily Pivot Point S1 | 1.3601 |
| Daily Pivot Point S2 | 1.3564 |
| Daily Pivot Point S3 | 1.3520 |
| Daily Pivot Point R1 | 1.3683 |
| Daily Pivot Point R2 | 1.3727 |
| Daily Pivot Point R3 | 1.3765 |
[/s2If]
Download Nehcap EAWe have two EAs that are operational on our LIVE accounts.
- EA-FIX: Check out the details here. Download EA-FIX . EA-FIX is a non-grid HFT scalper.
- EA-GROWTH: High quality low dd EA using trend grids. Download EA_GROWTHJoin Our Telegram Group


