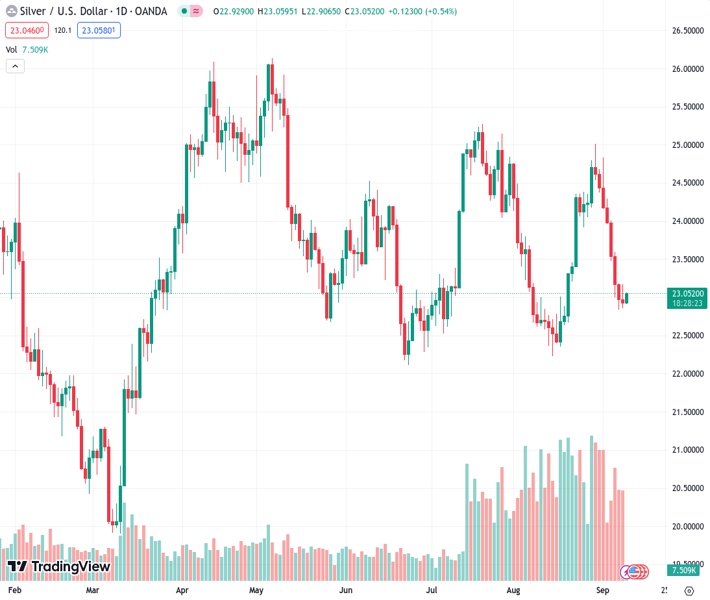
The price of silver, represented by the XAGUSD symbol, rises and ends an eight-day period of losses by rebounding from a low point reached over two weeks ago.
…
This is a premium post.
[s2If !current_user_can(access_s2member_level4)]Please register for FREE REGISTER to read full post below containing analysis. In case of any error or you think you are not able to read the full post below, please email us at support#nehcap.com [lwa][/s2If] [s2If current_user_can(access_s2member_level1)]
- Silver gains positive traction and snaps an eight-day losing streak to over a two-week low.
The pair currently trades last at 23.050.
The previous day high was 23.18 while the previous day low was 22.86. The daily 38.2% Fib levels comes at 22.98, expected to provide support. Similarly, the daily 61.8% fib level is at 23.05, expected to provide resistance.
Silver attracts some buyers on the first day of a new week, snapping an eight-day losing streak, and climbs back above the $23.00 round-figure mark during the Asian session. The white metal, however, remains well within the striking distance of a two-and-half-week low, around the $22.85-$22.80 region retested on Friday, and still seems vulnerable to slide further.
The negative outlook is reinforced by the fact that oscillators on the daily chart have been gaining negative traction and are away from being in the oversold zone. Moreover, the Relative Strength Index (RSI) on the 4-hour chart has also recovered from the oversold territory. This, in turn, suggests that the path of least resistance for the XAG/USD remains to the downside.
Hence, any subsequent move up might still be seen as a selling opportunity and remain capped near the very important 200-day Simple Moving Average (SMA), currently pegged near the $23.45-$23.50 area. This is followed by the 100-day SMA barrier, around the $23.80 region, and the $24.00 mark, which if cleared decisively will negate the negative outlook for the XAG/USD.
The subsequent short-covering move has the potential to lift the white metal beyond the $24.30-$24.35 supply zone, towards reclaiming the $25.00 psychological mark. The latter represents the August monthly swing high and should act as a pivotal point. A sustained strength beyond will be seen as a fresh trigger for bullish traders and pave the way for a further appreciating move.
On the flip side, bearish traders need to wait for some follow-through selling below the $22.85-$22.80 area before placing fresh bets. The XAG/USD might then accelerate the fall below the $22.65-$22.60 support, towards challenging a strong horizontal support near the $22.20-$22.10 zone. This is followed by the $22.00 mark, which if broken will confirm a fresh breakdown.
Technical Levels: Supports and Resistances
XAGUSD currently trading at 23.04 at the time of writing. Pair opened at 22.93 and is trading with a change of 0.48 % .
| Overview | Overview.1 | |
|---|---|---|
| 0 | Today last price | 23.04 |
| 1 | Today Daily Change | 0.11 |
| 2 | Today Daily Change % | 0.48 |
| 3 | Today daily open | 22.93 |
The pair remains strongly bearish on the daily time frame. It trades below the 20 SMA @ 23.56, 50 SMA 23.74, 100 SMA @ 23.84 and 200 SMA @ 23.47.
| Trends | Trends.1 | |
|---|---|---|
| 0 | Daily SMA20 | 23.56 |
| 1 | Daily SMA50 | 23.74 |
| 2 | Daily SMA100 | 23.84 |
| 3 | Daily SMA200 | 23.47 |
The previous day high was 23.18 while the previous day low was 22.86. The daily 38.2% Fib levels comes at 22.98, expected to provide support. Similarly, the daily 61.8% fib level is at 23.05, expected to provide resistance.
Note the levels of interest below:
- Pivot support is noted at 22.8, 22.67, 22.48
- Pivot resistance is noted at 23.12, 23.3, 23.44
| Levels | Levels.1 |
|---|---|
| Previous Daily High | 23.18 |
| Previous Daily Low | 22.86 |
| Previous Weekly High | 24.30 |
| Previous Weekly Low | 22.83 |
| Previous Monthly High | 25.02 |
| Previous Monthly Low | 22.23 |
| Daily Fibonacci 38.2% | 22.98 |
| Daily Fibonacci 61.8% | 23.05 |
| Daily Pivot Point S1 | 22.80 |
| Daily Pivot Point S2 | 22.67 |
| Daily Pivot Point S3 | 22.48 |
| Daily Pivot Point R1 | 23.12 |
| Daily Pivot Point R2 | 23.30 |
| Daily Pivot Point R3 | 23.44 |
[/s2If]
Download Nehcap EAWe have two EAs that are operational on our LIVE accounts.
- EA-FIX: Check out the details here. Download EA-FIX . EA-FIX is a non-grid HFT scalper.
- EA-GROWTH: High quality low dd EA using trend grids. Download EA_GROWTHJoin Our Telegram Group


