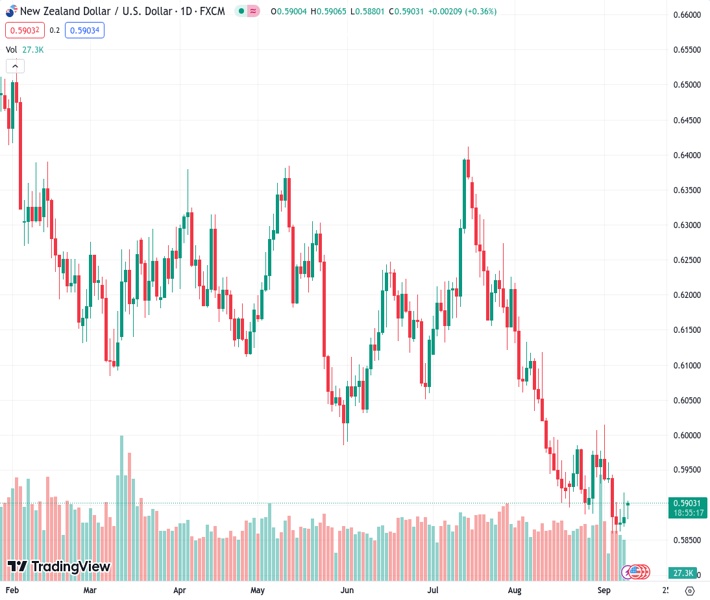
The NZDUSD pair remains above the 0.5900 range as the US Treasury bond continues to decrease.
…
This is a premium post.
[s2If !current_user_can(access_s2member_level4)]Please register for FREE REGISTER to read full post below containing analysis. In case of any error or you think you are not able to read the full post below, please email us at support#nehcap.com [lwa][/s2If] [s2If current_user_can(access_s2member_level1)]
- NZD/USD holds above the 0.5900 area amid the declining US Treasury bond.
The pair currently trades last at 0.59047.
The previous day high was 0.5919 while the previous day low was 0.5847. The daily 38.2% Fib levels comes at 0.5891, expected to provide support. Similarly, the daily 61.8% fib level is at 0.5874, expected to provide support.
The NZD/USD pair recovers some lost ground and reclaims the 0.5900 mark during the early Asian trading hours on Monday. The absence of economic data on the US economic calendar and declining US Treasury bond yields weighed on the USD, providing support for the NZD/USD pair. The pair currently trades near 0.5901, gaining 0.31% on the day.
New Zealand’s Manufacturing Sales for the second quarter improved to 2.9% versus a 2.1% drop in the previous reading, Statistics New Zealand reported last week. Additionally, the ANZ Commodity Price for August fell to 2.9% from a 2.6% drop in July. The nation’s Terms of Trade Index improved to 0.4% in the second quarter, compared to a decline of 1.5% in the previous reading and an expected drop of 1.3%.
Apart from this, the fear of China’s deflation erased as the Chinese inflation data improved in August. This, in turn, lifts the China-proxy New Zealand Dollar (NZD) against the Greenback. Data released on Saturday revealed that Chinese inflation, measured by the Consumer Price Index (CPI) for August came in at 0.1% YoY versus a 0.3% drop in the previous reading, a worse-than-expected 0.2% rise. The monthly figure came in at 0.3%, as expected. Finally, the Producer Price Index (PPI) declined 3.0% YoY from a 4.4% drop in July and in line with estimates.
Across the pond, the encouraging US economic data last week lends support to the higher for longer interest rate narrative in the US. The markets have priced in a 93% chance of a rate hold at the September meeting and a 43.5% chance of a rate hike at the November meeting, according to the CME FedWatch Tool. The hawkish stance from the Federal Reserve (Fed) could boost the US Dollar and act as a headwind for the NZD/USD pair.
Later this week, the US Consumer Price Index for August and Retail Sales will be released on Wednesday and Thursday, respectively. There will be no top-tier economic data released from the New Zealand docket. However, the Chinese Retail Sales and Industrial Production data due on Friday might influence the Kiwi. Traders will take a cue from the figures and find trading opportunities for the NZD/USD pair.
Technical Levels: Supports and Resistances
NZDUSD currently trading at 0.5904 at the time of writing. Pair opened at 0.5883 and is trading with a change of 0.36 % .
| Overview | Overview.1 | |
|---|---|---|
| 0 | Today last price | 0.5904 |
| 1 | Today Daily Change | 0.0021 |
| 2 | Today Daily Change % | 0.3600 |
| 3 | Today daily open | 0.5883 |
The pair remains strongly bearish on the daily time frame. It trades below the 20 SMA @ 0.593, 50 SMA 0.608, 100 SMA @ 0.6123 and 200 SMA @ 0.6211.
| Trends | Trends.1 | |
|---|---|---|
| 0 | Daily SMA20 | 0.5930 |
| 1 | Daily SMA50 | 0.6080 |
| 2 | Daily SMA100 | 0.6123 |
| 3 | Daily SMA200 | 0.6211 |
The previous day high was 0.5919 while the previous day low was 0.5847. The daily 38.2% Fib levels comes at 0.5891, expected to provide support. Similarly, the daily 61.8% fib level is at 0.5874, expected to provide support.
Note the levels of interest below:
- Pivot support is noted at 0.5847, 0.5811, 0.5775
- Pivot resistance is noted at 0.5919, 0.5955, 0.5991
| Levels | Levels.1 |
|---|---|
| Previous Daily High | 0.5919 |
| Previous Daily Low | 0.5847 |
| Previous Weekly High | 0.5961 |
| Previous Weekly Low | 0.5847 |
| Previous Monthly High | 0.6219 |
| Previous Monthly Low | 0.5885 |
| Daily Fibonacci 38.2% | 0.5891 |
| Daily Fibonacci 61.8% | 0.5874 |
| Daily Pivot Point S1 | 0.5847 |
| Daily Pivot Point S2 | 0.5811 |
| Daily Pivot Point S3 | 0.5775 |
| Daily Pivot Point R1 | 0.5919 |
| Daily Pivot Point R2 | 0.5955 |
| Daily Pivot Point R3 | 0.5991 |
[/s2If]
Download Nehcap EAWe have two EAs that are operational on our LIVE accounts.
- EA-FIX: Check out the details here. Download EA-FIX . EA-FIX is a non-grid HFT scalper.
- EA-GROWTH: High quality low dd EA using trend grids. Download EA_GROWTHJoin Our Telegram Group


