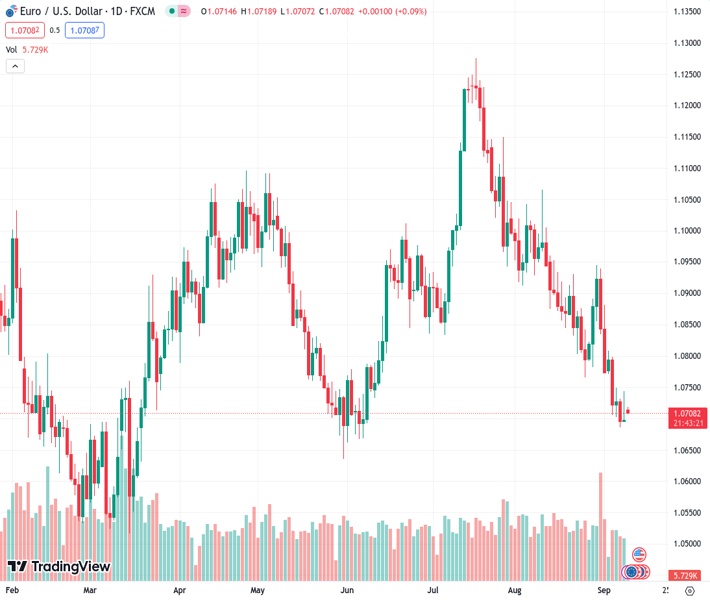
The EURUSD currency pair, currently trading at 1.07088, is experiencing continued downward pressure above the 1.0700 level due to concerns regarding a potential recession in the Eurozone.
…
This is a premium post.
[s2If !current_user_can(access_s2member_level4)]Please register for FREE REGISTER to read full post below containing analysis. In case of any error or you think you are not able to read the full post below, please email us at support#nehcap.com [lwa][/s2If] [s2If current_user_can(access_s2member_level1)]
- EUR/USD remains under pressure above the 1.0700 area amid the fear of a Eurozone recession.
The pair currently trades last at 1.07088.
The previous day high was 1.0744 while the previous day low was 1.0694. The daily 38.2% Fib levels comes at 1.0725, expected to provide resistance. Similarly, the daily 61.8% fib level is at 1.0713, expected to provide resistance.
The EUR/USD pair struggles to gain following the choppy action on Friday. The major hovers around 1.0710 during the early Asian session on Monday. The US Dollar (USD) snapped its eighth-week winning streak on Friday as the markets turned cautious ahead of the key inflation figure this week. Meanwhile, the US Dollar Index (DXY) holds below the 105.00 mark, down 0.14% on the day.
The upbeat US data last week might convince the Federal Reserve (Fed) to maintain the interest rate in the September meeting, but markets expected one more 25 basis points (bps) rate hike by the end of the year. According to the CME FedWatch Tool, markets have priced in a 93% possibility of holding the interest rate at the September meeting, while the odds of a rate hike in the November meeting are around 43.5%.
About the data, the US Initial Jobless Claims totaled 216,000 in the week ending September 2. This figure came in better than the market consensus of 234,000 and followed the previous week’s revised figure of 229,000 (from 228,000). Market participants will take more cues from the US Consumer Price Index (CPI) for August due on Wednesday.
On the other hand, the data released by Destatis on Friday revealed that the German Harmonised Consumer Price Index (HICP) for August came in at 6.4% YoY, as the market expected whereas the core CPI remained unchanged at 6.1%. Additionally, the Eurozone Gross Domestic Product (GDP) for the second quarter (Q2) grew 0.1% versus 0.3% prior and below the expected at 0.3%.The Euro has a volatile session and extends its downside as investors worry about the potential recession. The discouraging data might convince the European Central Bank (ECB) to abandon its hawkish stance for the upcoming meeting.
According to a Reuters poll, the majority of economists anticipate the European Central Bank (ECB) to hold interest rates unchanged at its next policy meeting scheduled for September 14. The ECB approach is based on incoming economic data. However, the US economic data in comparison to the Eurozone increases the possibility of the Fed’s “higher for longer” rate narrative.
Looking ahead, investors will closely monitor the release of the US Consumer Price Index (CPI) for August for fresh impetus. The monthly figure is expected to rise by 0.5%, while the core monthly figure is expected to remain at 0.2%. The attention will shift to the ECB’s monetary policy on Thursday. The event could give a clear direction for the EUR/USD pair.
Technical Levels: Supports and Resistances
EURUSD currently trading at 1.0712 at the time of writing. Pair opened at 1.0701 and is trading with a change of 0.1 % .
| Overview | Overview.1 | |
|---|---|---|
| 0 | Today last price | 1.0712 |
| 1 | Today Daily Change | 0.0011 |
| 2 | Today Daily Change % | 0.1000 |
| 3 | Today daily open | 1.0701 |
The pair remains strongly bearish on the daily time frame. It trades below the 20 SMA @ 1.0827, 50 SMA 1.095, 100 SMA @ 1.091 and 200 SMA @ 1.0823.
| Trends | Trends.1 | |
|---|---|---|
| 0 | Daily SMA20 | 1.0827 |
| 1 | Daily SMA50 | 1.0950 |
| 2 | Daily SMA100 | 1.0910 |
| 3 | Daily SMA200 | 1.0823 |
The previous day high was 1.0744 while the previous day low was 1.0694. The daily 38.2% Fib levels comes at 1.0725, expected to provide resistance. Similarly, the daily 61.8% fib level is at 1.0713, expected to provide resistance.
Note the levels of interest below:
- Pivot support is noted at 1.0682, 1.0663, 1.0632
- Pivot resistance is noted at 1.0732, 1.0763, 1.0781
| Levels | Levels.1 |
|---|---|
| Previous Daily High | 1.0744 |
| Previous Daily Low | 1.0694 |
| Previous Weekly High | 1.0809 |
| Previous Weekly Low | 1.0686 |
| Previous Monthly High | 1.1065 |
| Previous Monthly Low | 1.0766 |
| Daily Fibonacci 38.2% | 1.0725 |
| Daily Fibonacci 61.8% | 1.0713 |
| Daily Pivot Point S1 | 1.0682 |
| Daily Pivot Point S2 | 1.0663 |
| Daily Pivot Point S3 | 1.0632 |
| Daily Pivot Point R1 | 1.0732 |
| Daily Pivot Point R2 | 1.0763 |
| Daily Pivot Point R3 | 1.0781 |
[/s2If]
Download Nehcap EAWe have two EAs that are operational on our LIVE accounts.
- EA-FIX: Check out the details here. Download EA-FIX . EA-FIX is a non-grid HFT scalper.
- EA-GROWTH: High quality low dd EA using trend grids. Download EA_GROWTHJoin Our Telegram Group


