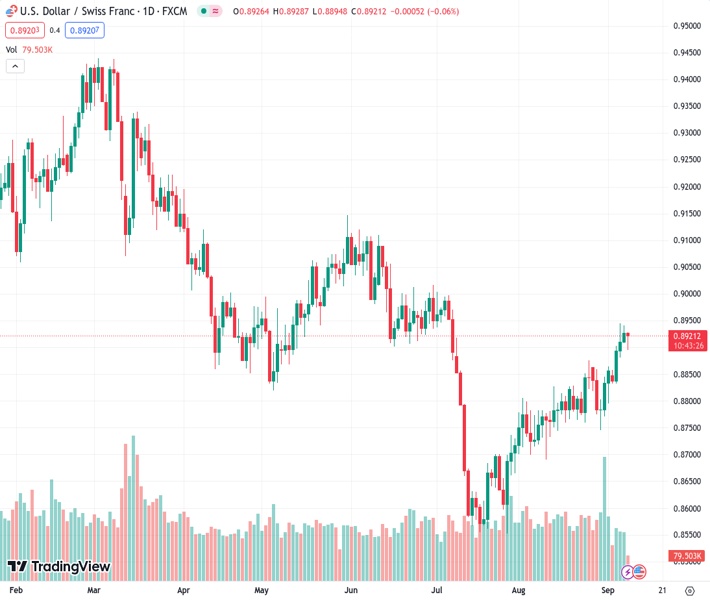
The USDCHF pair experienced a bounce back from the 0.8900 level, with the support of the strong US Dollar.
…
This is a premium post.
[s2If !current_user_can(access_s2member_level4)]Please register for FREE REGISTER to read full post below containing analysis. In case of any error or you think you are not able to read the full post below, please email us at support#nehcap.com [lwa][/s2If] [s2If current_user_can(access_s2member_level1)]
- USD/CHF rebounds from 0.8900, supported by the resilient US Dollar.
The pair currently trades last at 0.89181.
The previous day high was 0.894 while the previous day low was 0.8908. The daily 38.2% Fib levels comes at 0.8928, expected to provide resistance. Similarly, the daily 61.8% fib level is at 0.8921, expected to provide resistance.
The USD/CHF pair rebounds after correcting to near the crucial support of 0.8900, supported by the resilient US Dollar amid the risk-off market mood. The Swiss Franc asset remains broadly strong as the appeal for the US Dollar is firm due to deepening global uncertainties.
S&P500 futures generated decent gains in the European session due to the risk-aversion theme. US equities also faced selling pressure on Thursday as sheer strength in the United States economy could allow the Federal Reserve (Fed) to discuss further policy tightening actively.
For September monetary policy, Fed policymakers: Dallas Fed Bank President Lorie Logan and New York Fed Bank President John Williams showed no interest in increasing interest rates further.
The Swiss Franc remained in action as the Swiss economy remained stagnant in the April-June quarter while investors anticipated a growth rate of 0.1%. In the January-March quarter, the Swiss economy grew by 0.3%.
USD/CHF rally pauses after reaching to near the previous resistance zone placed in a range of 0.8900-0.9020 on a four-hour scale. The asset is trading in a Rising Channel chart pattern in which each corrective move is considered as a buying opportunity by the market participants. The 50-period Exponential Moving Average (EMA) at around 0.8870 continues to provide support to the US Dollar bulls.
Meanwhile, the Relative Strength Index (RSI) (14) trades in the bullish range of 60.00-80.00, which indicates that the upside impulse is already active.
For a fresh upside, the asset needs to climb above the psychological resistance of 0.9000, which will drive the asset toward June 15 high at 0.9056, followed by June 12 high at 0.9109.
In an alternate scenario, a breakdown below April 30 low around 0.8750 would expose the asset to August 10 low at 0.8890 and July 24 low at 0.8637.
Technical Levels: Supports and Resistances
USDCHF currently trading at 0.8917 at the time of writing. Pair opened at 0.8928 and is trading with a change of -0.12 % .
| Overview | Overview.1 | |
|---|---|---|
| 0 | Today last price | 0.8917 |
| 1 | Today Daily Change | -0.0011 |
| 2 | Today Daily Change % | -0.1200 |
| 3 | Today daily open | 0.8928 |
The pair is trading above its 20 Daily moving average @ 0.8824, above its 50 Daily moving average @ 0.8778 , above its 100 Daily moving average @ 0.8879 and below its 200 Daily moving average @ 0.9056
| Trends | Trends.1 | |
|---|---|---|
| 0 | Daily SMA20 | 0.8824 |
| 1 | Daily SMA50 | 0.8778 |
| 2 | Daily SMA100 | 0.8879 |
| 3 | Daily SMA200 | 0.9056 |
The previous day high was 0.894 while the previous day low was 0.8908. The daily 38.2% Fib levels comes at 0.8928, expected to provide resistance. Similarly, the daily 61.8% fib level is at 0.8921, expected to provide resistance.
Note the levels of interest below:
- Pivot support is noted at 0.8911, 0.8894, 0.8879
- Pivot resistance is noted at 0.8942, 0.8957, 0.8974
| Levels | Levels.1 |
|---|---|
| Previous Daily High | 0.8940 |
| Previous Daily Low | 0.8908 |
| Previous Weekly High | 0.8865 |
| Previous Weekly Low | 0.8745 |
| Previous Monthly High | 0.8876 |
| Previous Monthly Low | 0.8690 |
| Daily Fibonacci 38.2% | 0.8928 |
| Daily Fibonacci 61.8% | 0.8921 |
| Daily Pivot Point S1 | 0.8911 |
| Daily Pivot Point S2 | 0.8894 |
| Daily Pivot Point S3 | 0.8879 |
| Daily Pivot Point R1 | 0.8942 |
| Daily Pivot Point R2 | 0.8957 |
| Daily Pivot Point R3 | 0.8974 |
[/s2If]
Download Nehcap EAWe have two EAs that are operational on our LIVE accounts.
- EA-FIX: Check out the details here. Download EA-FIX . EA-FIX is a non-grid HFT scalper.
- EA-GROWTH: High quality low dd EA using trend grids. Download EA_GROWTHJoin Our Telegram Group


