In the past hour, the currency pair USDJPY has bounced back by around 100 pips from its lowest point of the day and has reached a new high for the day.
…
This is a premium post.
[s2If !current_user_can(access_s2member_level4)]Please register for FREE REGISTER to read full post below containing analysis. In case of any error or you think you are not able to read the full post below, please email us at support#nehcap.com [lwa][/s2If] [s2If current_user_can(access_s2member_level1)]
- USD/JPY recovers nearly 100 pips from the daily low and refreshes the daily high in the last hour.
The pair currently trades last at 147.166.
The previous day high was 147.88 while the previous day low was 147.04. The daily 38.2% Fib levels comes at 147.36, expected to provide resistance. Similarly, the daily 61.8% fib level is at 147.56, expected to provide resistance.
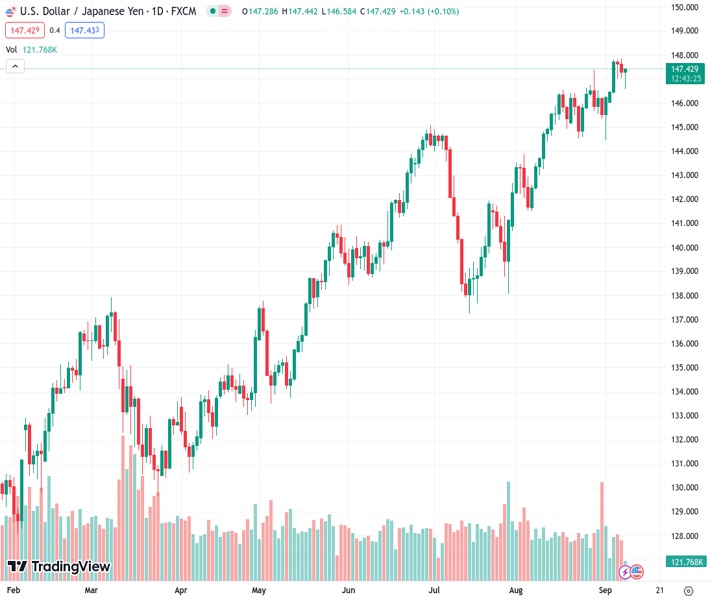
The USD/JPY pair attracts some dip-buying in the vicinity of mid-146.00s, or the 200-hour Simple Moving Average (SMA) on Friday and stalls this week’s corrective pullback from its highest level since November 2022. Spot prices build on the steady intraday ascent through the early part of the European session and climb to a fresh daily peak, around the 147.45 region in the last hour.
A downward revision of Japan’s second-quarter GDP growth ensures that the Bank of Japan (BoJ) will stick to its ultra-loose policy setting, which undermines the Japanese Yen (JPY) and lends some support to the USD/JPY pair. That said, speculations that Japanese authorities will intervene in the markets to prop up the domestic currency and revive safe-haven demand should limit losses for the JPY. Apart from this, a modest US Dollar (USD) pullback from a six-month top, triggered by retreating US Treasury bond yields, might hold back bulls from placing aggressive bets around the major.
The prospects for further policy tightening by the Federal Reserve (Fed), however, favour the USD bulls and suggest that the path of least resistance for the USD/JPY pair is to the upside. Moreover, technical indicators on the daily chart are holding comfortably in the positive territory and are still far from being in the overbought zone, validating the positive outlook. Hence, a subsequent strength back towards retesting the YTD peak, around the 147.80-147.85 region, looks like a distinct possibility. Some follow-through buying beyond the 148.00 mark will set the stage for additional gains.
On the flip side, the 147.00 round figure now seems to protect the immediate downside ahead of the 200-period SMA on the 4-hour chart, just ahead of the mid-146.00s. A convincing break below might prompt some technical selling and pave the way for some meaningful corrective decline. The USD/JPY pair might then accelerate the fall towards the 146.20 intermediate support en route to the 146.00 mark and the 145.45 horizontal support. The downward trajectory could get extended further towards the 145.00 psychological mark and the monthly low, around the 144.45 region.
Technical Levels: Supports and Resistances
USDJPY currently trading at 147.4 at the time of writing. Pair opened at 147.3 and is trading with a change of 0.07 % .
| Overview | Overview.1 | |
|---|---|---|
| 0 | Today last price | 147.40 |
| 1 | Today Daily Change | 0.10 |
| 2 | Today Daily Change % | 0.07 |
| 3 | Today daily open | 147.30 |
The pair remains strongly bullish on the daily timeframe. It trades above its 20 SMA @ 146.12, 50 SMA 143.48, 100 SMA @ 141.04 and 200 SMA @ 137.02.
| Trends | Trends.1 | |
|---|---|---|
| 0 | Daily SMA20 | 146.12 |
| 1 | Daily SMA50 | 143.48 |
| 2 | Daily SMA100 | 141.04 |
| 3 | Daily SMA200 | 137.02 |
The previous day high was 147.88 while the previous day low was 147.04. The daily 38.2% Fib levels comes at 147.36, expected to provide resistance. Similarly, the daily 61.8% fib level is at 147.56, expected to provide resistance.
Note the levels of interest below:
- Pivot support is noted at 146.94, 146.57, 146.11
- Pivot resistance is noted at 147.77, 148.24, 148.6
| Levels | Levels.1 |
|---|---|
| Previous Daily High | 147.88 |
| Previous Daily Low | 147.04 |
| Previous Weekly High | 147.38 |
| Previous Weekly Low | 144.44 |
| Previous Monthly High | 147.38 |
| Previous Monthly Low | 141.51 |
| Daily Fibonacci 38.2% | 147.36 |
| Daily Fibonacci 61.8% | 147.56 |
| Daily Pivot Point S1 | 146.94 |
| Daily Pivot Point S2 | 146.57 |
| Daily Pivot Point S3 | 146.11 |
| Daily Pivot Point R1 | 147.77 |
| Daily Pivot Point R2 | 148.24 |
| Daily Pivot Point R3 | 148.60 |
[/s2If]
Download Nehcap EAWe have two EAs that are operational on our LIVE accounts.
- EA-FIX: Check out the details here. Download EA-FIX . EA-FIX is a non-grid HFT scalper.
- EA-GROWTH: High quality low dd EA using trend grids. Download EA_GROWTHJoin Our Telegram Group


