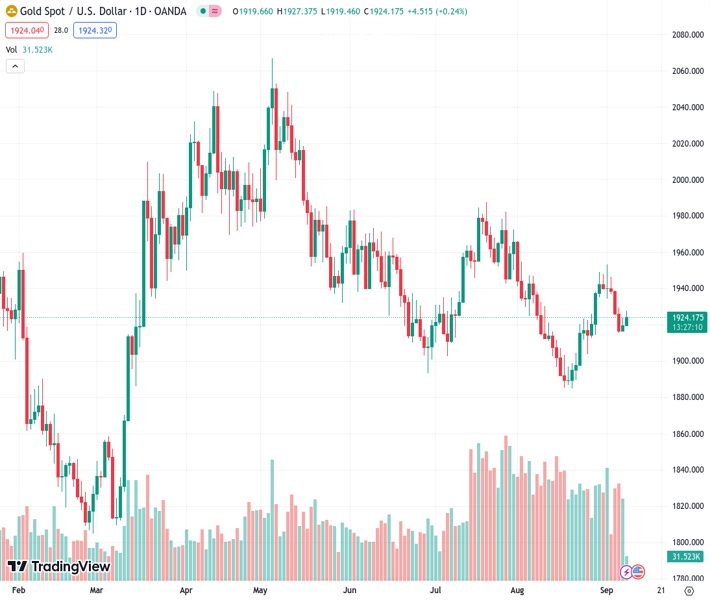
For the second day in a row, the gold price at 1,920.48 has enticed a number of buyers and is being bolstered by various factors.
…
This is a premium post.
[s2If !current_user_can(access_s2member_level4)]Please register for FREE REGISTER to read full post below containing analysis. In case of any error or you think you are not able to read the full post below, please email us at support#nehcap.com [lwa][/s2If] [s2If current_user_can(access_s2member_level1)]
- Gold price attracts some buyers for the second successive day and draws support from a combination of factors.
The pair currently trades last at 1920.48.
The previous day high was 1923.63 while the previous day low was 1916.29. The daily 38.2% Fib levels comes at 1920.83, expected to provide resistance. Similarly, the daily 61.8% fib level is at 1919.09, expected to provide support.
Gold price gains some positive traction for the second successive day and recovers further from over a one-week low, around the $1,915 region touched on Wednesday. The XAU/USD maintains its bid through the early European session and currently trades around the $1,925-$1,926 area, up over 0.30% for the day.
Against the backdrop of concerns about the worsening economic conditions in China, a downward revision of Japan’s second-quarter GDP growth fuels worries about a deeper global downturn. Apart from this, the worsening US-China relations – the world’s two largest economies – drive some haven flows towards the Gold price. The Wall Street Journal reported on Wednesday that China has ordered officials at central government agencies not to bring iPhones into the office or use them for work.
This comes after US Secretary of Commerce Gina Raimondo’s comments earlier this week that she doesn’t expect any changes to the US tariffs imposed on China by the Trump administration until the ongoing review by the US Treasury is complete. The developments continue to weigh on investors’ sentiment, which is evident from the prevalent cautious mood around the equity markets. Apart from this, a modest US Dollar (USD) weakness is seen lending additional support to the Gold price.
Reviving safe-haven demand leads to a further decline in the US Treasury bond yields and prompts traders to lighten their USD bullish bets, especially after the recent rally to the highest level since March 9. A weaker Greenback tends to underpin demand for the US Dollar-denominated commodities, including the Gold price. That said, growing acceptance that the Federal Reserve (Fed) will stick to its hawkish stance and keep interest rates higher for longer might cap the upside for the XAU/USD.
The incoming stronger-than-expected macro data from the United States (US), including the ISM Services PMI on Wednesday and Weekly Jobless Claims on Thursday, points to a resilient economy. The narrative, meanwhile, supports prospects for further policy tightening by the Fed, which, in turn, should limit any meaningful downside for the US bond yields and the USD. This, in turn, might hold back traders from placing aggressive bullish bets around the non-yielding Gold price.
Market participants might also prefer to wait on the sidelines ahead of China inflation data and the G20 leaders summit over the weekend. Hence, some follow-through buying is needed to confirm that the recent pullback from a one-month peak, around the $1,953 area touched last Friday, has run its course. Bears, on the other hand, might still wait for a sustained break and acceptance below the 200-day Simple Moving Average (SMA) before placing fresh bets around the Gold price.
Nevertheless, the XAU/USD remains on track to register losses for the first time in the previous three weeks. In the absence of any relevant market-moving economic data from the US, the US bond yields will continue to play a key role in influencing the USD price dynamics. Apart from this, the broader risk sentiment will drive demand for safe-haven assets and further contribute to producing short-term trading opportunities around the Gold price on the last day of the week.
Technical Levels: Supports and Resistances
XAUUSD currently trading at 1925.47 at the time of writing. Pair opened at 1919.72 and is trading with a change of 0.3 % .
| Overview | Overview.1 | |
|---|---|---|
| 0 | Today last price | 1925.47 |
| 1 | Today Daily Change | 5.75 |
| 2 | Today Daily Change % | 0.30 |
| 3 | Today daily open | 1919.72 |
The pair is trading above its 20 Daily moving average @ 1915.73, below its 50 Daily moving average @ 1932.23 , below its 100 Daily moving average @ 1951.29 and above its 200 Daily moving average @ 1918.3
| Trends | Trends.1 | |
|---|---|---|
| 0 | Daily SMA20 | 1915.73 |
| 1 | Daily SMA50 | 1932.23 |
| 2 | Daily SMA100 | 1951.29 |
| 3 | Daily SMA200 | 1918.30 |
The previous day high was 1923.63 while the previous day low was 1916.29. The daily 38.2% Fib levels comes at 1920.83, expected to provide resistance. Similarly, the daily 61.8% fib level is at 1919.09, expected to provide support.
Note the levels of interest below:
- Pivot support is noted at 1916.13, 1912.54, 1908.79
- Pivot resistance is noted at 1923.47, 1927.22, 1930.81
| Levels | Levels.1 |
|---|---|
| Previous Daily High | 1923.63 |
| Previous Daily Low | 1916.29 |
| Previous Weekly High | 1953.01 |
| Previous Weekly Low | 1912.84 |
| Previous Monthly High | 1966.08 |
| Previous Monthly Low | 1884.85 |
| Daily Fibonacci 38.2% | 1920.83 |
| Daily Fibonacci 61.8% | 1919.09 |
| Daily Pivot Point S1 | 1916.13 |
| Daily Pivot Point S2 | 1912.54 |
| Daily Pivot Point S3 | 1908.79 |
| Daily Pivot Point R1 | 1923.47 |
| Daily Pivot Point R2 | 1927.22 |
| Daily Pivot Point R3 | 1930.81 |
[/s2If]
Download Nehcap EAWe have two EAs that are operational on our LIVE accounts.
- EA-FIX: Check out the details here. Download EA-FIX . EA-FIX is a non-grid HFT scalper.
- EA-GROWTH: High quality low dd EA using trend grids. Download EA_GROWTHJoin Our Telegram Group


