The EURUSD currency pair is currently trading at 1.0696, which is an increase of 0.01%. However, it is still below the important level of 1.0700, suggesting that there is a possibility of further decline in the future.
…
This is a premium post.
[s2If !current_user_can(access_s2member_level4)]Please register for FREE REGISTER to read full post below containing analysis. In case of any error or you think you are not able to read the full post below, please email us at support#nehcap.com [lwa][/s2If] [s2If current_user_can(access_s2member_level1)]
- EUR/USD trades at 1.0696, up 0.01%, but remains below the pivotal 1.0700 mark, signaling potential for further downside.
The pair currently trades last at 1.07067.
The previous day high was 1.0749 while the previous day low was 1.0703. The daily 38.2% Fib levels comes at 1.0731, expected to provide resistance. Similarly, the daily 61.8% fib level is at 1.072, expected to provide resistance.
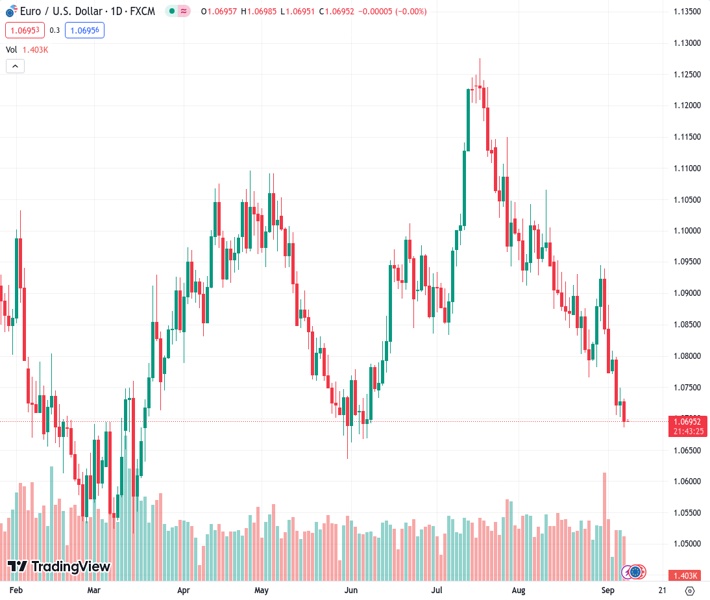
The EUR/USD begins the Asian session almost flat but below the 1.0700 figure, seen as a bearish signal, after printing losses of 0.29% on Thursday, which could open the door to test May lows. At the time of writing, the major trades at 1.0696, up 0.01%.
The daily chart portrays a continuation of the downtrend, as the pair achieved a new lower-low and trades near the bottom of the weekly range. However, being the 1.0700 figure that usually keeps the EUR/USD seesawing in the top/bottom of the double zero mark, buyers and sellers need to take action to win the battle.
For buyers, the EUR/USD must climb above 1.0700 and reclaim the September 6 daily high of 1.0748, an intermediate resistance level. Once cleared, the pair’s next ceiling level would be the September 5 high at 1.0798 before challenging the 200-day Moving Average (DMA) at 1.0822.
On the flip side, and the most likely scenario, due to recent economic data and the EUR/USD breaking decisively below the 200-DMA, the first support would be the May 31 daily low of 1.0635. A breach of the latter will expose the psychological 1.0600 figure, followed by the March 15 swing low of 1.0516.
Technical Levels: Supports and Resistances
EURUSD currently trading at 1.0696 at the time of writing. Pair opened at 1.0727 and is trading with a change of -0.29 % .
| Overview | Overview.1 | |
|---|---|---|
| 0 | Today last price | 1.0696 |
| 1 | Today Daily Change | -0.0031 |
| 2 | Today Daily Change % | -0.2900 |
| 3 | Today daily open | 1.0727 |
The pair remains strongly bearish on the daily time frame. It trades below the 20 SMA @ 1.0853, 50 SMA 1.0957, 100 SMA @ 1.0916 and 200 SMA @ 1.0822.
| Trends | Trends.1 | |
|---|---|---|
| 0 | Daily SMA20 | 1.0853 |
| 1 | Daily SMA50 | 1.0957 |
| 2 | Daily SMA100 | 1.0916 |
| 3 | Daily SMA200 | 1.0822 |
The previous day high was 1.0749 while the previous day low was 1.0703. The daily 38.2% Fib levels comes at 1.0731, expected to provide resistance. Similarly, the daily 61.8% fib level is at 1.072, expected to provide resistance.
Note the levels of interest below:
- Pivot support is noted at 1.0704, 1.068, 1.0657
- Pivot resistance is noted at 1.075, 1.0772, 1.0796
| Levels | Levels.1 |
|---|---|
| Previous Daily High | 1.0749 |
| Previous Daily Low | 1.0703 |
| Previous Weekly High | 1.0946 |
| Previous Weekly Low | 1.0772 |
| Previous Monthly High | 1.1065 |
| Previous Monthly Low | 1.0766 |
| Daily Fibonacci 38.2% | 1.0731 |
| Daily Fibonacci 61.8% | 1.0720 |
| Daily Pivot Point S1 | 1.0704 |
| Daily Pivot Point S2 | 1.0680 |
| Daily Pivot Point S3 | 1.0657 |
| Daily Pivot Point R1 | 1.0750 |
| Daily Pivot Point R2 | 1.0772 |
| Daily Pivot Point R3 | 1.0796 |
[/s2If]
Download Nehcap EAWe have two EAs that are operational on our LIVE accounts.
- EA-FIX: Check out the details here. Download EA-FIX . EA-FIX is a non-grid HFT scalper.
- EA-GROWTH: High quality low dd EA using trend grids. Download EA_GROWTHJoin Our Telegram Group


