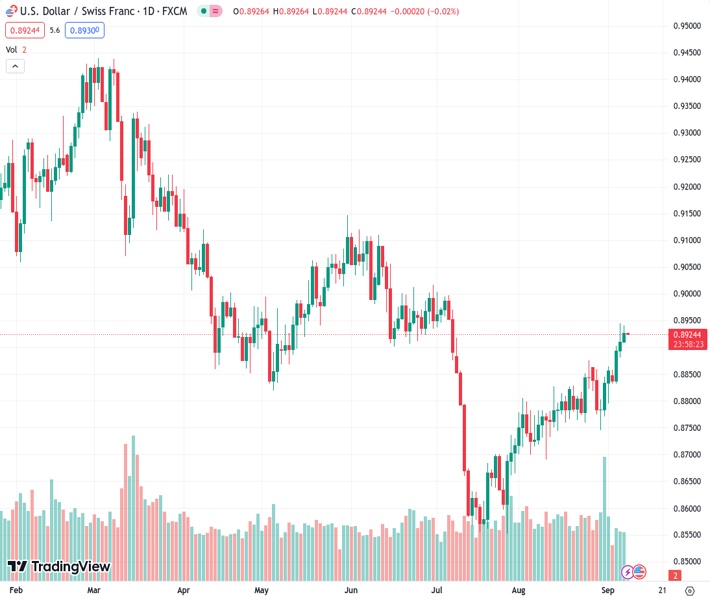
The USDCHF currency pair, currently at 0.89277, increased to 0.8925, reflecting a daily gain of 0.20%.
…
This is a premium post.
[s2If !current_user_can(access_s2member_level4)]Please register for FREE REGISTER to read full post below containing analysis. In case of any error or you think you are not able to read the full post below, please email us at support#nehcap.com [lwa][/s2If] [s2If current_user_can(access_s2member_level1)]
- USD/CHF rose to 0.8925, up by 0.20% daily.
The pair currently trades last at 0.89277.
The previous day high was 0.8945 while the previous day low was 0.8881. The daily 38.2% Fib levels comes at 0.8921, expected to provide support. Similarly, the daily 61.8% fib level is at 0.8906, expected to provide support.
On Thursday, the USD/CHF continued to gain ground, driven by a strong USD whose DXY index traded at highs since March above 105.00.
On the data front, the US reported that Initial Jobless Claims came in lower than expected in the first week of September, with the headline figure at 216,000, lower than the expected figure of 234,000 and decelerating from the previous 229,000. On the Swiss side, the Unemployment rate came in at 2.1% in August, matching the consensus.
What’s strengthening the USD seems to be investors placing hawkish bets on the Federal Reserve (Fed) due to the continuing favourable reports of the US economic activity. Despite US Treasury yields decreasing, the CME FedWatch tool suggests that swaps markets are pricing in higher probabilities of nearly 40% of a 25 basis point (bps) hike by the Fed in the November and December meetings.
The daily chart analysis shows that the short-term outlook for USD/CHF appears bullish. The Relative Strength Index (RSI) and Moving Average Convergence Divergence (MACD) maintain favourable positions, with the RSI above its midline and displaying an upward trend and the MACD exhibiting green bars. In addition, the pair is above the 20 and 100-day Simple Moving Averages (SMAs), but below the 200-day SMA, pointing towards the prevailing strength of the bulls in the larger context.
Support levels: 0.8900, 0.8877 (100-day SMA), 0.8850.
Resistance levels: 0.8950, 0.9000, 0.9030.
Technical Levels: Supports and Resistances
USDCHF currently trading at 0.8928 at the time of writing. Pair opened at 0.8912 and is trading with a change of 0.18 % .
| Overview | Overview.1 | |
|---|---|---|
| 0 | Today last price | 0.8928 |
| 1 | Today Daily Change | 0.0016 |
| 2 | Today Daily Change % | 0.1800 |
| 3 | Today daily open | 0.8912 |
The pair is trading above its 20 Daily moving average @ 0.8816, above its 50 Daily moving average @ 0.8779 , above its 100 Daily moving average @ 0.8879 and below its 200 Daily moving average @ 0.9058
| Trends | Trends.1 | |
|---|---|---|
| 0 | Daily SMA20 | 0.8816 |
| 1 | Daily SMA50 | 0.8779 |
| 2 | Daily SMA100 | 0.8879 |
| 3 | Daily SMA200 | 0.9058 |
The previous day high was 0.8945 while the previous day low was 0.8881. The daily 38.2% Fib levels comes at 0.8921, expected to provide support. Similarly, the daily 61.8% fib level is at 0.8906, expected to provide support.
Note the levels of interest below:
- Pivot support is noted at 0.888, 0.8849, 0.8817
- Pivot resistance is noted at 0.8944, 0.8976, 0.9007
| Levels | Levels.1 |
|---|---|
| Previous Daily High | 0.8945 |
| Previous Daily Low | 0.8881 |
| Previous Weekly High | 0.8865 |
| Previous Weekly Low | 0.8745 |
| Previous Monthly High | 0.8876 |
| Previous Monthly Low | 0.8690 |
| Daily Fibonacci 38.2% | 0.8921 |
| Daily Fibonacci 61.8% | 0.8906 |
| Daily Pivot Point S1 | 0.8880 |
| Daily Pivot Point S2 | 0.8849 |
| Daily Pivot Point S3 | 0.8817 |
| Daily Pivot Point R1 | 0.8944 |
| Daily Pivot Point R2 | 0.8976 |
| Daily Pivot Point R3 | 0.9007 |
[/s2If]
Download Nehcap EAWe have two EAs that are operational on our LIVE accounts.
- EA-FIX: Check out the details here. Download EA-FIX . EA-FIX is a non-grid HFT scalper.
- EA-GROWTH: High quality low dd EA using trend grids. Download EA_GROWTHJoin Our Telegram Group


