Despite the halt in the rise of US Treasury bond yields, the price of silver, symbolized by #XAGUSD, drops by 0.83%. This decline is attributed to the release of robust US jobless claims data, indicating possible additional actions from the Federal Reserve.
…
This is a premium post.
[s2If !current_user_can(access_s2member_level4)]Please register for FREE REGISTER to read full post below containing analysis. In case of any error or you think you are not able to read the full post below, please email us at support#nehcap.com [lwa][/s2If] [s2If current_user_can(access_s2member_level1)]
- Silver falls 0.83% despite a pause in US Treasury bond yield uptrend, as strong US jobless claims data hints at further Fed action.
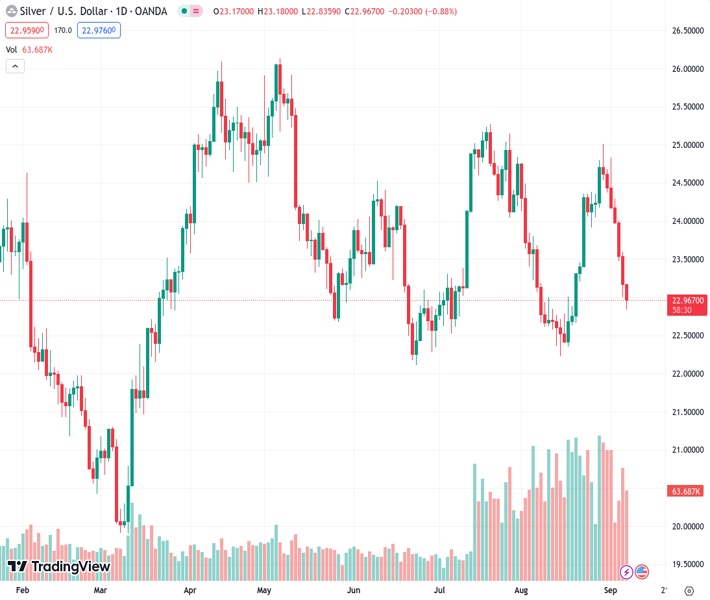
The pair currently trades last at 22.983.
The previous day high was 23.6 while the previous day low was 23.0. The daily 38.2% Fib levels comes at 23.23, expected to provide resistance. Similarly, the daily 61.8% fib level is at 23.37, expected to provide resistance.
Silver price plunged 0.83%, although US Treasury bond yields paused their uptrend after data from the United States (US) sponsored speculations the US Federal Reserve is not done raising interest rates. Despite this, the Greenback (USD) is rising a headwind for the white metal. The XAG/USD is trading at $22.97 per troy ounce after hitting a daily high of $23.18.
The precious metals segment, mainly the white metal, is under pressure, as Gold remains steady at $1,920.00 a troy ounce, gaining 0.18%. Solid data revealed by the US Department of Labor showed that Americans filling for unemployment claims was below expectations of 229K in the last week, with data coming at 216K. Although weekly measures tend to be volatile, Continuing Claims fell by 40K to 1.679 million in the week ending August 26, the lowest level since the week ended on July 15.
Given that the latest US Nonfarm Payrolls report for August was solid, despite seeing an uptick in the Unemployment Rate from 3.5% to 3.8%, it appears the Fed still has work to do.
However, after today’s data, money markets do not expect any rate hikes from the US central bank for the remainder of the year. Even though chances of a 25 bps rate hike are still below 50%, next week’s data could spark discussions about November’s meeting.
Next week, the US Department of Labor will reveal inflation in the country. The Consumer Price Index (CPI) for August is expected to come at 3.4% YoY, while core CPI, which excludes volatile items, is foreseen at 4.5% YoY. The former is projected to increase compared to July’s data, contrarily to core CPI.
Upward revisions on the data would add to already high inflationary pressures in the US and trigger action by the Federal Reserve. Traders should be aware that policymakers will enter its blackout period on Saturday. So, any signals must be viewed with a pinch of salt, as next week’s data could trigger a change of direction in the US central bank.
If US data suggests further tightening is needed, that would be a headwind for precious metals, as US Treasury bond yields would likely advance. Traders must follow the direction of US real yields, which are US nominal bond yields minus inflation expectations. Currently, the US 10-year TIPS, seen as a proxy for real yields, stands at 1.955%, three bps below its opening price.
Silver price is set to extend its losses after decisively clearing the 200-day Moving Average (DMA) at $23.46, while the 50-DMA closes into the former, threatening to form a death-cross, seeing as a bearish signal. If XAG/USD achieves a daily close below $23.00, expect further downside, with the August 15 daily low of $22.23 seen as the next support before it tumbles toward the June 23 swing low of $22.11. Conversely, buyers’ initial resistance would be seen at the 200-DMA, followed by the 50-DMA at $23.71.
Technical Levels: Supports and Resistances
XAGUSD currently trading at 22.98 at the time of writing. Pair opened at 23.18 and is trading with a change of -0.86 % .
| Overview | Overview.1 | |
|---|---|---|
| 0 | Today last price | 22.98 |
| 1 | Today Daily Change | -0.20 |
| 2 | Today Daily Change % | -0.86 |
| 3 | Today daily open | 23.18 |
The pair remains strongly bearish on the daily time frame. It trades below the 20 SMA @ 23.53, 50 SMA 23.73, 100 SMA @ 23.89 and 200 SMA @ 23.47.
| Trends | Trends.1 | |
|---|---|---|
| 0 | Daily SMA20 | 23.53 |
| 1 | Daily SMA50 | 23.73 |
| 2 | Daily SMA100 | 23.89 |
| 3 | Daily SMA200 | 23.47 |
The previous day high was 23.6 while the previous day low was 23.0. The daily 38.2% Fib levels comes at 23.23, expected to provide resistance. Similarly, the daily 61.8% fib level is at 23.37, expected to provide resistance.
Note the levels of interest below:
- Pivot support is noted at 22.92, 22.67, 22.33
- Pivot resistance is noted at 23.52, 23.85, 24.11
| Levels | Levels.1 |
|---|---|
| Previous Daily High | 23.60 |
| Previous Daily Low | 23.00 |
| Previous Weekly High | 25.02 |
| Previous Weekly Low | 24.05 |
| Previous Monthly High | 25.02 |
| Previous Monthly Low | 22.23 |
| Daily Fibonacci 38.2% | 23.23 |
| Daily Fibonacci 61.8% | 23.37 |
| Daily Pivot Point S1 | 22.92 |
| Daily Pivot Point S2 | 22.67 |
| Daily Pivot Point S3 | 22.33 |
| Daily Pivot Point R1 | 23.52 |
| Daily Pivot Point R2 | 23.85 |
| Daily Pivot Point R3 | 24.11 |
[/s2If]
Download Nehcap EAWe have two EAs that are operational on our LIVE accounts.
- EA-FIX: Check out the details here. Download EA-FIX . EA-FIX is a non-grid HFT scalper.
- EA-GROWTH: High quality low dd EA using trend grids. Download EA_GROWTHJoin Our Telegram Group


