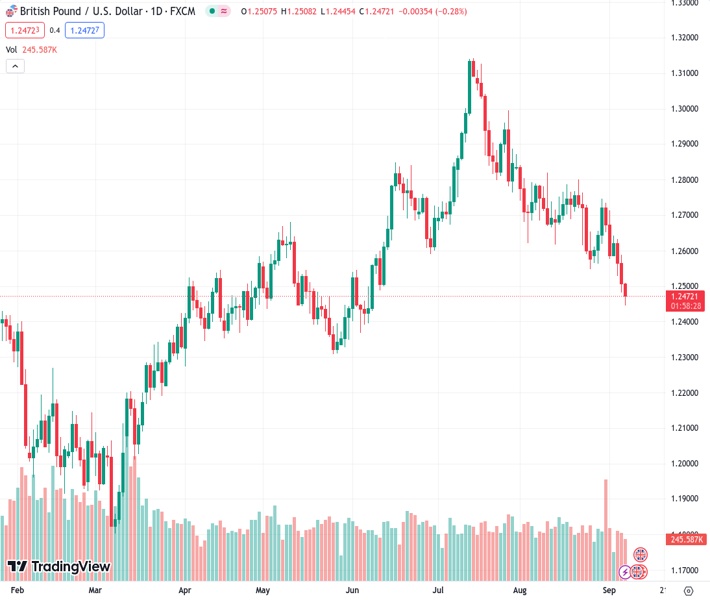
The GBPUSD currency pair, trading at a rate of 1.24836, has experienced a downward trend for the third day in a row, reaching levels near 1.2470.
…
This is a premium post.
[s2If !current_user_can(access_s2member_level4)]Please register for FREE REGISTER to read full post below containing analysis. In case of any error or you think you are not able to read the full post below, please email us at support#nehcap.com [lwa][/s2If] [s2If current_user_can(access_s2member_level1)]
- GBP/USD declined for a third consecutive day towards the 1.2470 area.
The pair currently trades last at 1.24836.
The previous day high was 1.2588 while the previous day low was 1.2482. The daily 38.2% Fib levels comes at 1.2523, expected to provide resistance. Similarly, the daily 61.8% fib level is at 1.2548, expected to provide resistance.
On Thursday, the GBP/USD turned south and seems to be heading to the 200-day Simple Moving Average (SMA) at 1.2420 for a restest. A resilient USD and falling British yields are responsible for the pair’s movements.
On the data front, Jobless Claims from the week ending on September 1 came in slightly lower at 216,000 vs. the 234,000 expected, decelerating from the previous weekly reading of 229,000. The initial reaction boosted the USD, and the DXY increased to nearly 105.10.
The US Treasury yields are retreating but remain high, suggesting investors are gearing up for another Federal Reserve (Fed) hike this cycle. The 2-year consolidated Wednesday’s upward movements and declined below 5%, while the 5 and 10-year yields stand at 4.38% and 4.26%. Regarding expectations, economic activity in the US remains robust and doesn’t show signs of cooling, which would give the Fed the green light to consider one last hike. In that sense, the CME FedWatch tool suggests that the odds of one more 25 basis point (bps) hike stand near 40%, keeping the USD afloat.
On the GBP’s side, the 2,5 and 10-year rates are seeing more than 1% declines and may reflect that investors foresee a less aggressive Bank of England (BoE). On Wednesday, Andrew Bailey commented that the bank would remain data-dependent and didn’t commit to further hikes. At the same time, Swati Dhingra pointed out that the policy is “sufficiently restrictive”.
The technical analysis of the daily chart points to a neutral to bearish outlook for GBP/USD, indicating the potential for further bearish movement. The Relative Strength Index (RSI) is getting nearer to oversold conditions, while the Moving Average Convergence (MACD) histogram presents rising red bars. Moreover, the pair is below the 20 and 100-day Simple Moving Averages (SMAs), but above the 200-day SMA, suggesting that despite the recent bearish sentiment, the bulls are still resilient, holding some momentum.
Support levels: 1.2420 (20-day SMA), 1.2400, 1.2380.
Resistance levels: 1.2470, 1.2500, 1.2550.
Technical Levels: Supports and Resistances
GBPUSD currently trading at 1.2473 at the time of writing. Pair opened at 1.2508 and is trading with a change of -0.28 % .
| Overview | Overview.1 | |
|---|---|---|
| 0 | Today last price | 1.2473 |
| 1 | Today Daily Change | -0.0035 |
| 2 | Today Daily Change % | -0.2800 |
| 3 | Today daily open | 1.2508 |
The pair is trading below its 20 Daily moving average @ 1.2665, below its 50 Daily moving average @ 1.2769 , below its 100 Daily moving average @ 1.2654 and above its 200 Daily moving average @ 1.2424
| Trends | Trends.1 | |
|---|---|---|
| 0 | Daily SMA20 | 1.2665 |
| 1 | Daily SMA50 | 1.2769 |
| 2 | Daily SMA100 | 1.2654 |
| 3 | Daily SMA200 | 1.2424 |
The previous day high was 1.2588 while the previous day low was 1.2482. The daily 38.2% Fib levels comes at 1.2523, expected to provide resistance. Similarly, the daily 61.8% fib level is at 1.2548, expected to provide resistance.
Note the levels of interest below:
- Pivot support is noted at 1.2464, 1.242, 1.2358
- Pivot resistance is noted at 1.257, 1.2632, 1.2676
| Levels | Levels.1 |
|---|---|
| Previous Daily High | 1.2588 |
| Previous Daily Low | 1.2482 |
| Previous Weekly High | 1.2746 |
| Previous Weekly Low | 1.2563 |
| Previous Monthly High | 1.2841 |
| Previous Monthly Low | 1.2548 |
| Daily Fibonacci 38.2% | 1.2523 |
| Daily Fibonacci 61.8% | 1.2548 |
| Daily Pivot Point S1 | 1.2464 |
| Daily Pivot Point S2 | 1.2420 |
| Daily Pivot Point S3 | 1.2358 |
| Daily Pivot Point R1 | 1.2570 |
| Daily Pivot Point R2 | 1.2632 |
| Daily Pivot Point R3 | 1.2676 |
[/s2If]
Download Nehcap EAWe have two EAs that are operational on our LIVE accounts.
- EA-FIX: Check out the details here. Download EA-FIX . EA-FIX is a non-grid HFT scalper.
- EA-GROWTH: High quality low dd EA using trend grids. Download EA_GROWTHJoin Our Telegram Group


