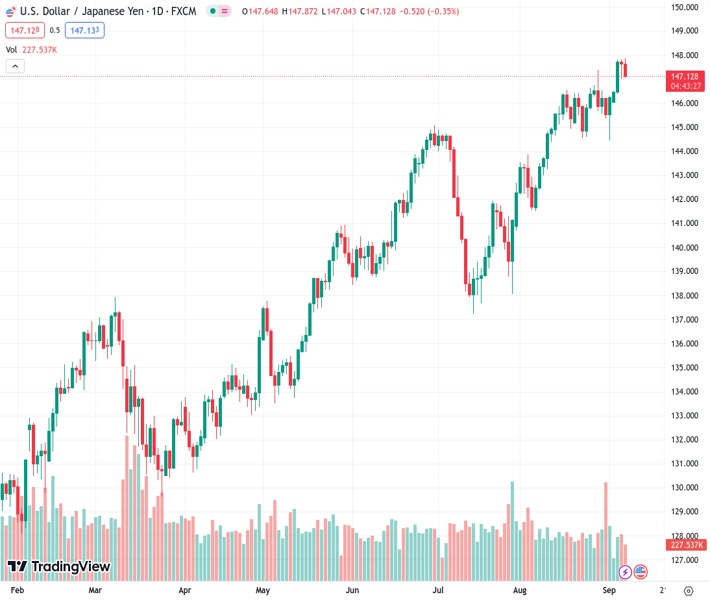
The USDJPY currency pair dropped by over 0.30% to approximately 147.20.
…
This is a premium post.
[s2If !current_user_can(access_s2member_level4)]Please register for FREE REGISTER to read full post below containing analysis. In case of any error or you think you are not able to read the full post below, please email us at support#nehcap.com [lwa][/s2If] [s2If current_user_can(access_s2member_level1)]
- USD/JPY declined more than 0.30% towards 147.20.
The pair currently trades last at 147.166.
The previous day high was 147.82 while the previous day low was 147.02. The daily 38.2% Fib levels comes at 147.32, expected to provide resistance. Similarly, the daily 61.8% fib level is at 147.51, expected to provide resistance.
On Thursday’s session, the USD/JPY slightly fell towards the 147.20 area, driven by the growing expectations of the Bank of Japan (BoJ) taking action to stop the JPY’s decline. On the other hand, the USD is consolidating, but hawkish bets on the Federal Reserve (Fed) limit the downside for the Greenback.
The US Bureau of Labour Statistics reported that the number of people filing for unemployment benefits increased but was lower than expected. The actual figure came in at 216,000 vs. the 234,000 expected and was lower than the previous weekly reading of 229,000.
Meanwhile, the USD measured by the DXY index holds above the 105.00 zone, its highest level since March. On the other hand, US Treasury yields slightly retreated but remained in weekly highs after yesterday’s rally following the strong ISM PMI figures from the US from August. In that sense, the CME FedWatch tool suggests that markets still bet on higher odds of one last hike by the Federal Reserve (Fed) in this cycle, and the odds of a 25 basis point in November and December stan near 40%.
However, those expectations may change after next week’s Consumer Price Index (CPI) figures from the US from August.
On the Bank of Japan’s (BoJ) front, Reuter reported that Japan’s top currency diplomat, Masato Kanda, stated that the Japanese banking authorities are considering an intervention to end “speculative” movements. In that sense, in case the BoJ steps in, the JPY may see some upside, but monetary policy divergences seem to be the main reason for Yen’s weakness. Furthermore, on Friday, investors will see Japan’s Gross Domestic Product (GDP) Q2 revision figures.
Observing the daily chart, the USD/JPY displays signs of bullish exhaustion, leading to a neutral to bearish technical perspective. The Relative Strength Index (RSI) displays a negative slope in the bullish territory, hinting at a potential shift in momentum, while the Moving Average Convergence (MACD) exhibits shorter green bars. In the broader context, the pair is above the 20,100,200-day Simple Moving Average (SMA), highlighting the continued dominance of bulls on the broader scale.
Support levels: 147.00, 146.50, 146.10 (20-day SMA).
Resistance levels: 147.50, 148.00, 148.50.
Technical Levels: Supports and Resistances
USDJPY currently trading at 147.18 at the time of writing. Pair opened at 147.66 and is trading with a change of -0.33 % .
| Overview | Overview.1 | |
|---|---|---|
| 0 | Today last price | 147.18 |
| 1 | Today Daily Change | -0.48 |
| 2 | Today Daily Change % | -0.33 |
| 3 | Today daily open | 147.66 |
The pair remains strongly bullish on the daily timeframe. It trades above its 20 SMA @ 146.0, 50 SMA 143.43, 100 SMA @ 140.91 and 200 SMA @ 136.96.
| Trends | Trends.1 | |
|---|---|---|
| 0 | Daily SMA20 | 146.00 |
| 1 | Daily SMA50 | 143.43 |
| 2 | Daily SMA100 | 140.91 |
| 3 | Daily SMA200 | 136.96 |
The previous day high was 147.82 while the previous day low was 147.02. The daily 38.2% Fib levels comes at 147.32, expected to provide resistance. Similarly, the daily 61.8% fib level is at 147.51, expected to provide resistance.
Note the levels of interest below:
- Pivot support is noted at 147.18, 146.7, 146.38
- Pivot resistance is noted at 147.98, 148.3, 148.78
| Levels | Levels.1 |
|---|---|
| Previous Daily High | 147.82 |
| Previous Daily Low | 147.02 |
| Previous Weekly High | 147.38 |
| Previous Weekly Low | 144.44 |
| Previous Monthly High | 147.38 |
| Previous Monthly Low | 141.51 |
| Daily Fibonacci 38.2% | 147.32 |
| Daily Fibonacci 61.8% | 147.51 |
| Daily Pivot Point S1 | 147.18 |
| Daily Pivot Point S2 | 146.70 |
| Daily Pivot Point S3 | 146.38 |
| Daily Pivot Point R1 | 147.98 |
| Daily Pivot Point R2 | 148.30 |
| Daily Pivot Point R3 | 148.78 |
[/s2If]
Download Nehcap EAWe have two EAs that are operational on our LIVE accounts.
- EA-FIX: Check out the details here. Download EA-FIX . EA-FIX is a non-grid HFT scalper.
- EA-GROWTH: High quality low dd EA using trend grids. Download EA_GROWTHJoin Our Telegram Group


