The US dollar to Canadian dollar exchange rate, at 1.36772, has increased by 0.35% to 1.3675 as the number of US jobless claims has fallen below expectations. This development is putting pressure on the Federal Reserve to prioritize achieving its 2% inflation goal.
…
This is a premium post.
[s2If !current_user_can(access_s2member_level4)]Please register for FREE REGISTER to read full post below containing analysis. In case of any error or you think you are not able to read the full post below, please email us at support#nehcap.com [lwa][/s2If] [s2If current_user_can(access_s2member_level1)]
- USD/CAD rises 0.35% to 1.3675 after US jobless claims fall below estimates, pressuring the Fed to focus on its 2% inflation target.
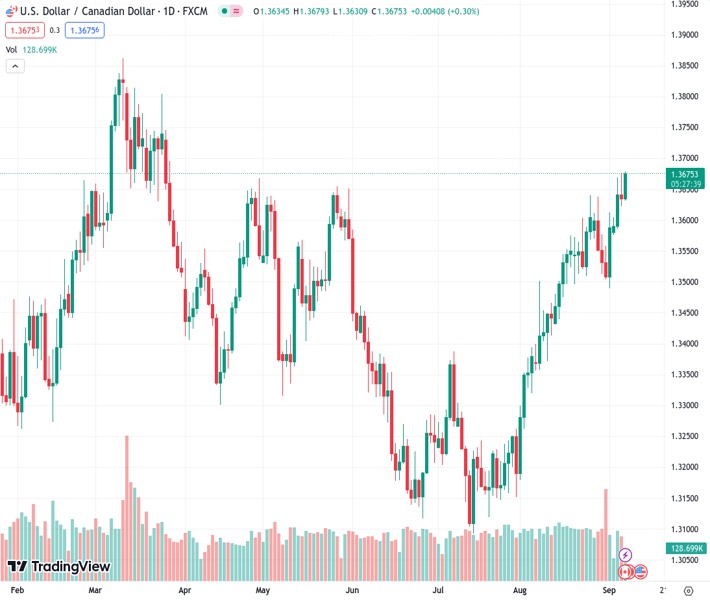
The pair currently trades last at 1.36772.
The previous day high was 1.3677 while the previous day low was 1.3623. The daily 38.2% Fib levels comes at 1.3643, expected to provide support. Similarly, the daily 61.8% fib level is at 1.3656, expected to provide support.
The US Dollar (USD) extends its advance against the Loonie (CAD) as data from both countries, although it remains positive, favors the Greenback. Powell’s saying “higher for longer” in his speeches continues to impact the markets, which remain wary of further tightening, boosting the USD. The USD/CAD is trading at 1.3675 and gains 0.35% after hitting a daily low of 1.3631.
The US Department of Labor showed that Initial Jobless Claims for the week ending September 2 rose by 216K, below estimates of 229K, indicating the jobs market is yet to loosen. This puts pressure on the US Federal Reserve (Fed), which focuses on bringing inflation towards its 2% goal.
Although Fed policymakers have begun to adopt a more cautious stance, the market’s reaction suggests the Fed could increase rates in the future. The CME FedWatch Tool depicts money markets have fully priced in the US central bank would keep rates unchanged in September. But for November, chances of a 25 bps increase lie at 43.5%.
The USD/CAD pair reacted to the upside on the data, even though US Treasury bond yields are unchanged. In the meantime, the US Dollar Index (DXY), a gauge of the buck’s value against a basket of peers, prints modest gains of 0.18
Another reason behind Loonie’s fall is crude oil prices are under pressure, down 0.31%, at $87.27, as the market awaits EIA inventories.
Recently, data from Canada showed that business activity expanded in August following a contraction of 48.6 in July. The Ivey PMI came at 53.5, indicating expansion, as shown by data on Thursday. Some subcomponents of the PMI showed an improvement, like employment and supplier deliveries. Although it paints an improved scenario, the latest Gross Domestic Product (GDP) report for the second quarter contracted -0.2%, denting the Bank of Canada (BoC) of a possible rate hike yesterday as the economy cools down.
The Canadian economic docket would feature employment data, while the US will release Wholesale Inventories and Fed speakers.
The pair resumed its uptrend, challenging a major resistance area at 1.3667, April’s 28 daily high. A daily close above the latter would expose the 1.3700 figure and then the March 24 high at 1.3804. Conversely, sellers could remain hopeful of lower prices if USD/CAD ends Thursday’s session below 1.3667. A breach of the latter would expose September’s 6 low of 1.3622 before diving towards September 4 low of 1.3586.
Technical Levels: Supports and Resistances
USDCAD currently trading at 1.3675 at the time of writing. Pair opened at 1.3636 and is trading with a change of 0.29 % .
| Overview | Overview.1 | |
|---|---|---|
| 0 | Today last price | 1.3675 |
| 1 | Today Daily Change | 0.0039 |
| 2 | Today Daily Change % | 0.2900 |
| 3 | Today daily open | 1.3636 |
The pair remains strongly bullish on the daily timeframe. It trades above its 20 SMA @ 1.3547, 50 SMA 1.3371, 100 SMA @ 1.3402 and 200 SMA @ 1.3465.
| Trends | Trends.1 | |
|---|---|---|
| 0 | Daily SMA20 | 1.3547 |
| 1 | Daily SMA50 | 1.3371 |
| 2 | Daily SMA100 | 1.3402 |
| 3 | Daily SMA200 | 1.3465 |
The previous day high was 1.3677 while the previous day low was 1.3623. The daily 38.2% Fib levels comes at 1.3643, expected to provide support. Similarly, the daily 61.8% fib level is at 1.3656, expected to provide support.
Note the levels of interest below:
- Pivot support is noted at 1.3613, 1.3591, 1.3559
- Pivot resistance is noted at 1.3668, 1.37, 1.3722
| Levels | Levels.1 |
|---|---|
| Previous Daily High | 1.3677 |
| Previous Daily Low | 1.3623 |
| Previous Weekly High | 1.3637 |
| Previous Weekly Low | 1.3489 |
| Previous Monthly High | 1.3640 |
| Previous Monthly Low | 1.3184 |
| Daily Fibonacci 38.2% | 1.3643 |
| Daily Fibonacci 61.8% | 1.3656 |
| Daily Pivot Point S1 | 1.3613 |
| Daily Pivot Point S2 | 1.3591 |
| Daily Pivot Point S3 | 1.3559 |
| Daily Pivot Point R1 | 1.3668 |
| Daily Pivot Point R2 | 1.3700 |
| Daily Pivot Point R3 | 1.3722 |
[/s2If]
Download Nehcap EAWe have two EAs that are operational on our LIVE accounts.
- EA-FIX: Check out the details here. Download EA-FIX . EA-FIX is a non-grid HFT scalper.
- EA-GROWTH: High quality low dd EA using trend grids. Download EA_GROWTHJoin Our Telegram Group


