The value of silver drops to $23 due to the strong performance of the US labor market.
…
This is a premium post.
[s2If !current_user_can(access_s2member_level4)]Please register for FREE REGISTER to read full post below containing analysis. In case of any error or you think you are not able to read the full post below, please email us at support#nehcap.com [lwa][/s2If] [s2If current_user_can(access_s2member_level1)]
- Silver price plummets to $23 as the US labor market remains resilient.
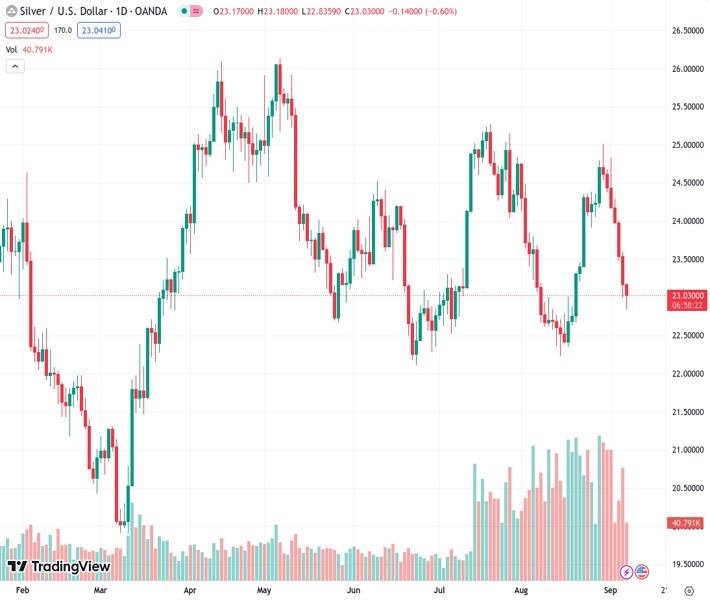
The pair currently trades last at 23.010.
The previous day high was 23.6 while the previous day low was 23.0. The daily 38.2% Fib levels comes at 23.23, expected to provide resistance. Similarly, the daily 61.8% fib level is at 23.37, expected to provide resistance.
Silver price (XAG/USD) corrected significantly to near $23.00 as United States labor market indicators outperformed expectations. The white metal faces selling pressure as the US Department of Labor reported that individuals claiming jobless benefits for the first time dropped to 216K for the week ending September 01 vs. expectations of 234K and the former release of 229K.
Meanwhile, Q2 Unit Labor Costs jumped to 2.2% vs. expectations and the former release of 1.6%. Decent wage growth would keep households’ disposable income higher and might eventually keep inflationary pressures stubborn.
The S&P500 opens on a negative note as the tight US labor market would allow the Federal Reserve (Fed) to keep doors open for further policy tightening. The Fed is widely expected to keep interest rates unchanged in September monetary policy. As per the CME Fedwatch Tool, traders see a 93% chance for interest rates to remain unchanged at 5.25%-5.50% in the September policy meeting.
The US Dollar Index (DXY) edges marginally lower from its five-month high of 105.10. However, the upside bias is still solid as the market mood is quite cautious. For further action, investors will focus on the Consumer Price Index (CPI) for August, which will be released next week.
Silver price corrects vertically to near the 200-day Exponential Moving Average (EMA), which trades around $23.30. The white metal forms a Head and Shoulder chart pattern, which is a bearish reversal pattern. The neckline of the aforementioned formation is placed from June 22 low at $22.18.
The Relative Strength Index (RSI) (14) drops to near 40.00. A bearish impulse would be activated if it breaks below the same.
Technical Levels: Supports and Resistances
XAGUSD currently trading at 23.07 at the time of writing. Pair opened at 23.18 and is trading with a change of -0.47 % .
| Overview | Overview.1 | |
|---|---|---|
| 0 | Today last price | 23.07 |
| 1 | Today Daily Change | -0.11 |
| 2 | Today Daily Change % | -0.47 |
| 3 | Today daily open | 23.18 |
The pair remains strongly bearish on the daily time frame. It trades below the 20 SMA @ 23.53, 50 SMA 23.73, 100 SMA @ 23.89 and 200 SMA @ 23.47.
| Trends | Trends.1 | |
|---|---|---|
| 0 | Daily SMA20 | 23.53 |
| 1 | Daily SMA50 | 23.73 |
| 2 | Daily SMA100 | 23.89 |
| 3 | Daily SMA200 | 23.47 |
The previous day high was 23.6 while the previous day low was 23.0. The daily 38.2% Fib levels comes at 23.23, expected to provide resistance. Similarly, the daily 61.8% fib level is at 23.37, expected to provide resistance.
Note the levels of interest below:
- Pivot support is noted at 22.92, 22.67, 22.33
- Pivot resistance is noted at 23.52, 23.85, 24.11
| Levels | Levels.1 |
|---|---|
| Previous Daily High | 23.60 |
| Previous Daily Low | 23.00 |
| Previous Weekly High | 25.02 |
| Previous Weekly Low | 24.05 |
| Previous Monthly High | 25.02 |
| Previous Monthly Low | 22.23 |
| Daily Fibonacci 38.2% | 23.23 |
| Daily Fibonacci 61.8% | 23.37 |
| Daily Pivot Point S1 | 22.92 |
| Daily Pivot Point S2 | 22.67 |
| Daily Pivot Point S3 | 22.33 |
| Daily Pivot Point R1 | 23.52 |
| Daily Pivot Point R2 | 23.85 |
| Daily Pivot Point R3 | 24.11 |
[/s2If]
Download Nehcap EAWe have two EAs that are operational on our LIVE accounts.
- EA-FIX: Check out the details here. Download EA-FIX . EA-FIX is a non-grid HFT scalper.
- EA-GROWTH: High quality low dd EA using trend grids. Download EA_GROWTHJoin Our Telegram Group


