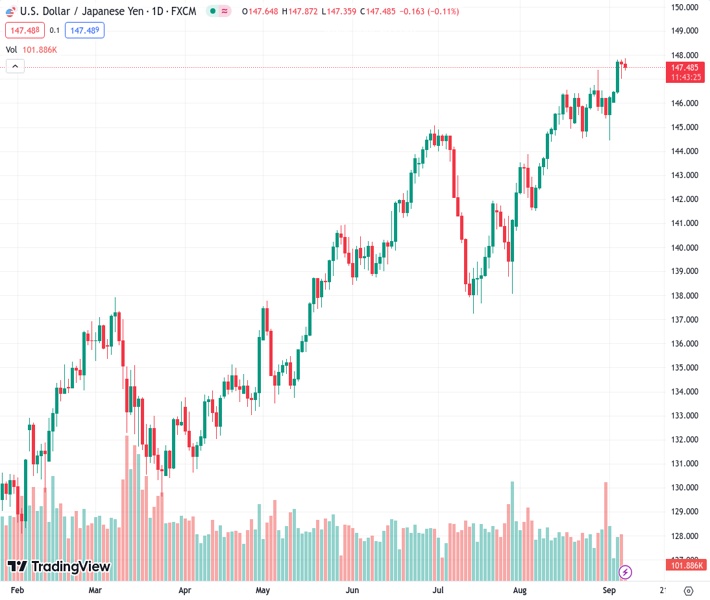
The USDJPY pair, trading at 147.488, is further experiencing declines due to rumors about the Japanese government’s potential stimulus actions.
…
This is a premium post.
[s2If !current_user_can(access_s2member_level4)]Please register for FREE REGISTER to read full post below containing analysis. In case of any error or you think you are not able to read the full post below, please email us at support#nehcap.com [lwa][/s2If] [s2If current_user_can(access_s2member_level1)]
- USD/JPY extends losses on the chatter surrounding stimulus measures by the Japanese government.
The pair currently trades last at 147.488.
The previous day high was 147.82 while the previous day low was 147.02. The daily 38.2% Fib levels comes at 147.32, expected to provide support. Similarly, the daily 61.8% fib level is at 147.51, expected to provide resistance.
USD/JPY extends its losses on the second day, trading around 147.40 below the Year-To-Date (YTD) high during the European session on Thursday. The pair experienced downward pressure after the moderate economic data from the United States (US).
Additionally, Kyodo News citing anonymous sources, the Japanese government is reportedly planning to introduce new economic stimulus measures in October. The primary objectives of these stimulus measures, as mentioned in the news, are to provide support for companies to increase wages and reduce energy costs.
The Moving Average Convergence Divergence (MACD) line stays above the centerline and lies above the signal line. This suggests that the recent momentum is relatively stronger.
The 147.50 psychological level acts as the immediate barrier, followed by the weekly high at 147.87. A break above the latter could support the USD/JPY pair to explore the region around the 148.00 level.
On the downside, the 14-day Exponential Moving Average (EMA) at 146.37 emerges as the key support, following the 21-day EMA at 145.81 aligned to the 23.6% Fibonacci retracement at 145.37 level.
In the short term, the USD/JPY pair remains to be bullish as long as the 14-day Relative Strength Index (RSI) stays above 50.
Technical Levels: Supports and Resistances
USDJPY currently trading at 147.42 at the time of writing. Pair opened at 147.66 and is trading with a change of -0.16 % .
| Overview | Overview.1 | |
|---|---|---|
| 0 | Today last price | 147.42 |
| 1 | Today Daily Change | -0.24 |
| 2 | Today Daily Change % | -0.16 |
| 3 | Today daily open | 147.66 |
The pair remains strongly bullish on the daily timeframe. It trades above its 20 SMA @ 146.0, 50 SMA 143.43, 100 SMA @ 140.91 and 200 SMA @ 136.96.
| Trends | Trends.1 | |
|---|---|---|
| 0 | Daily SMA20 | 146.00 |
| 1 | Daily SMA50 | 143.43 |
| 2 | Daily SMA100 | 140.91 |
| 3 | Daily SMA200 | 136.96 |
The previous day high was 147.82 while the previous day low was 147.02. The daily 38.2% Fib levels comes at 147.32, expected to provide support. Similarly, the daily 61.8% fib level is at 147.51, expected to provide resistance.
Note the levels of interest below:
- Pivot support is noted at 147.18, 146.7, 146.38
- Pivot resistance is noted at 147.98, 148.3, 148.78
| Levels | Levels.1 |
|---|---|
| Previous Daily High | 147.82 |
| Previous Daily Low | 147.02 |
| Previous Weekly High | 147.38 |
| Previous Weekly Low | 144.44 |
| Previous Monthly High | 147.38 |
| Previous Monthly Low | 141.51 |
| Daily Fibonacci 38.2% | 147.32 |
| Daily Fibonacci 61.8% | 147.51 |
| Daily Pivot Point S1 | 147.18 |
| Daily Pivot Point S2 | 146.70 |
| Daily Pivot Point S3 | 146.38 |
| Daily Pivot Point R1 | 147.98 |
| Daily Pivot Point R2 | 148.30 |
| Daily Pivot Point R3 | 148.78 |
[/s2If]
Download Nehcap EAWe have two EAs that are operational on our LIVE accounts.
- EA-FIX: Check out the details here. Download EA-FIX . EA-FIX is a non-grid HFT scalper.
- EA-GROWTH: High quality low dd EA using trend grids. Download EA_GROWTHJoin Our Telegram Group


